


- Orbital Insight Blog
- Bluer Oceans with Geospatial Trade Area
Blog
Bluer Oceans with Geospatial Trade Area
Deriving the True Trade Area
Trade area modeling allows retailers and property owners to better select sites and forecast retail revenues by understanding real-time site characteristics such as the ‘draw’ of a center. Fixed radial trade areas based on government demographics are often outdated and do not represent actual patterns or customer bases. A Commercial Observer article describes the drawback of legacy site selection methods perfectly:
“A five-mile range in New York City is going to be in New Jersey,” Patrick O’Brien, director of analytics at Winick Realty Group, said with a laugh and a shake of his head. Some scouting methods are even more analog: “I still see those guys with a [foot-traffic] clicker out there,” he said.
Newer spatial data sources such as location intelligence are now able to create highly accurate and even predictive trade area models by leveraging IoT device data, demographics, and drive times.
Using our self-service geospatial platform, Orbital Insight GO, we’ve found that trade areas rarely form perfect radial 1, 3, or 5-mile rings. In fact, further analysis including travel distances, home, and work locations, and route modeling show significant cannibalization from direct channel competitors and even nearby locations of the same franchise.
Here are just a few examples of IoT-based trade area models, based on the most proximate 50% of customers.
Toyota:
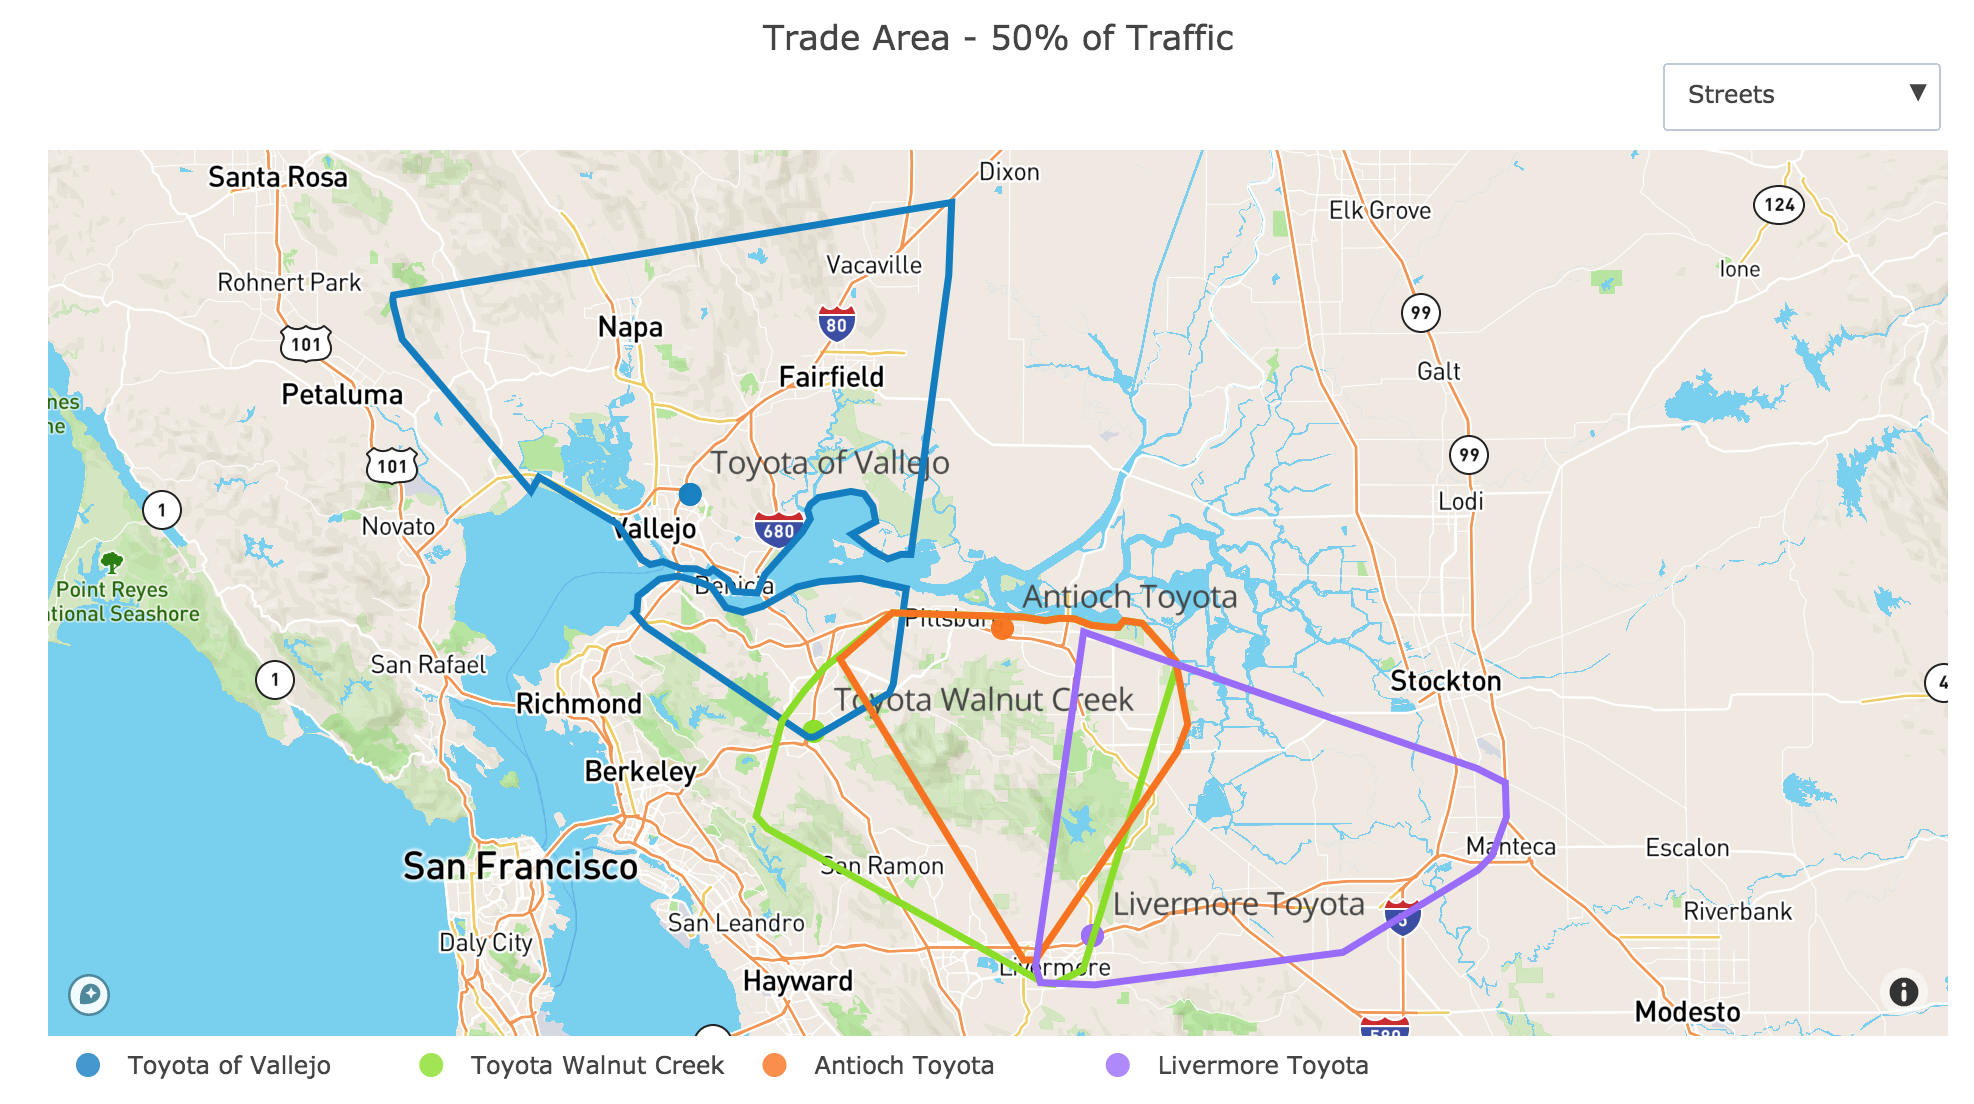
Above: Orbital Insight GO detects a significant overlap in trade area between East Bay Toyota dealerships.
At Toyota dealerships in the San Francisco East Bay area, there are significant overlaps, especially between Antioch Toyota and Toyota Walnut Creek, which may imply cannibalization and thus opportunities to better spend advertising dollars.
Cinemas:
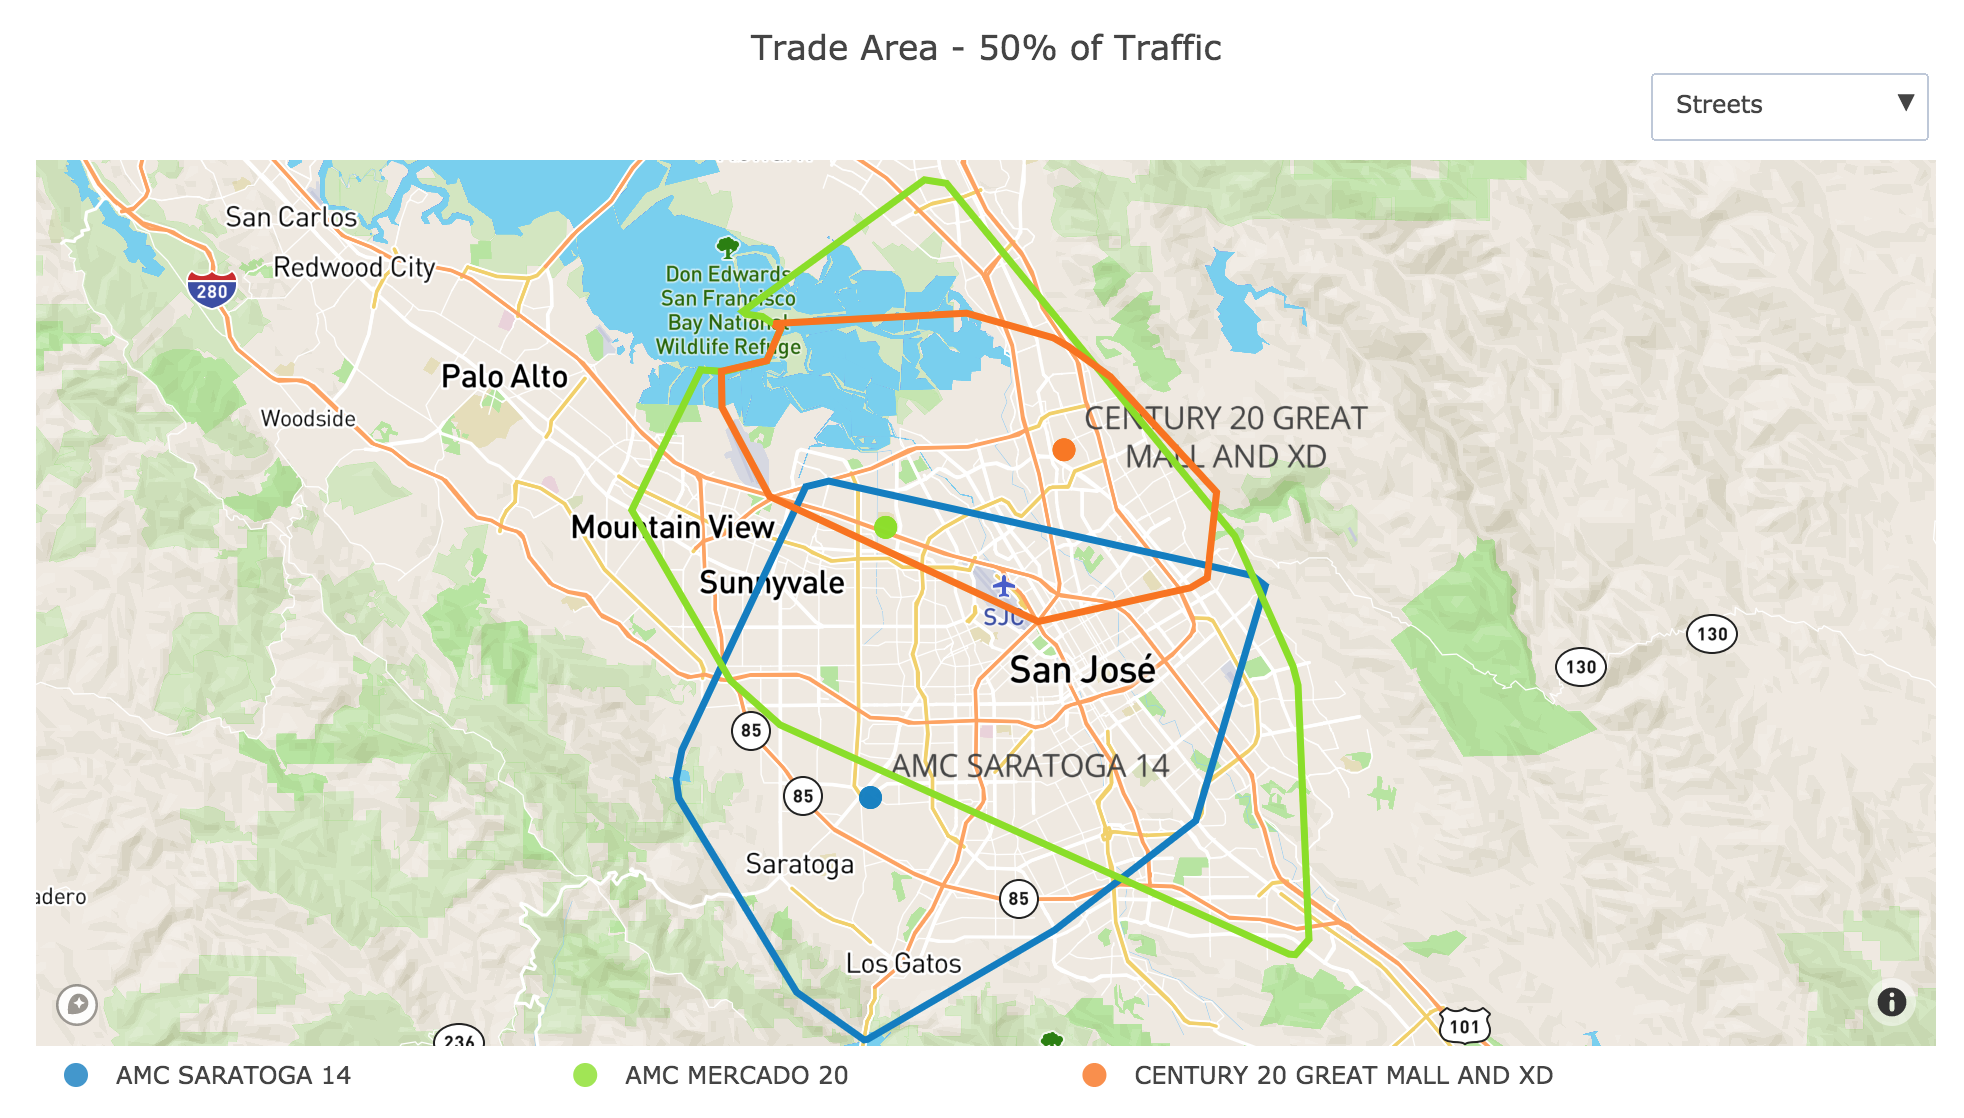
Above: Orbital Insight GO detects significant overlap between AMC theaters and Century 20 Great Mall.
We analyzed movie theaters across chains, AMC and Century, and have observed overlap between the AMC Mercado which fully envelops the customer base for Century 20 Great Mall, which is a competitor.
Meanwhile, we see that the two AMC theaters — Mercado and Saratoga actually do overlap and thus their advertising dollars might be spent the best outside of the overlap area.
Chase Branches:
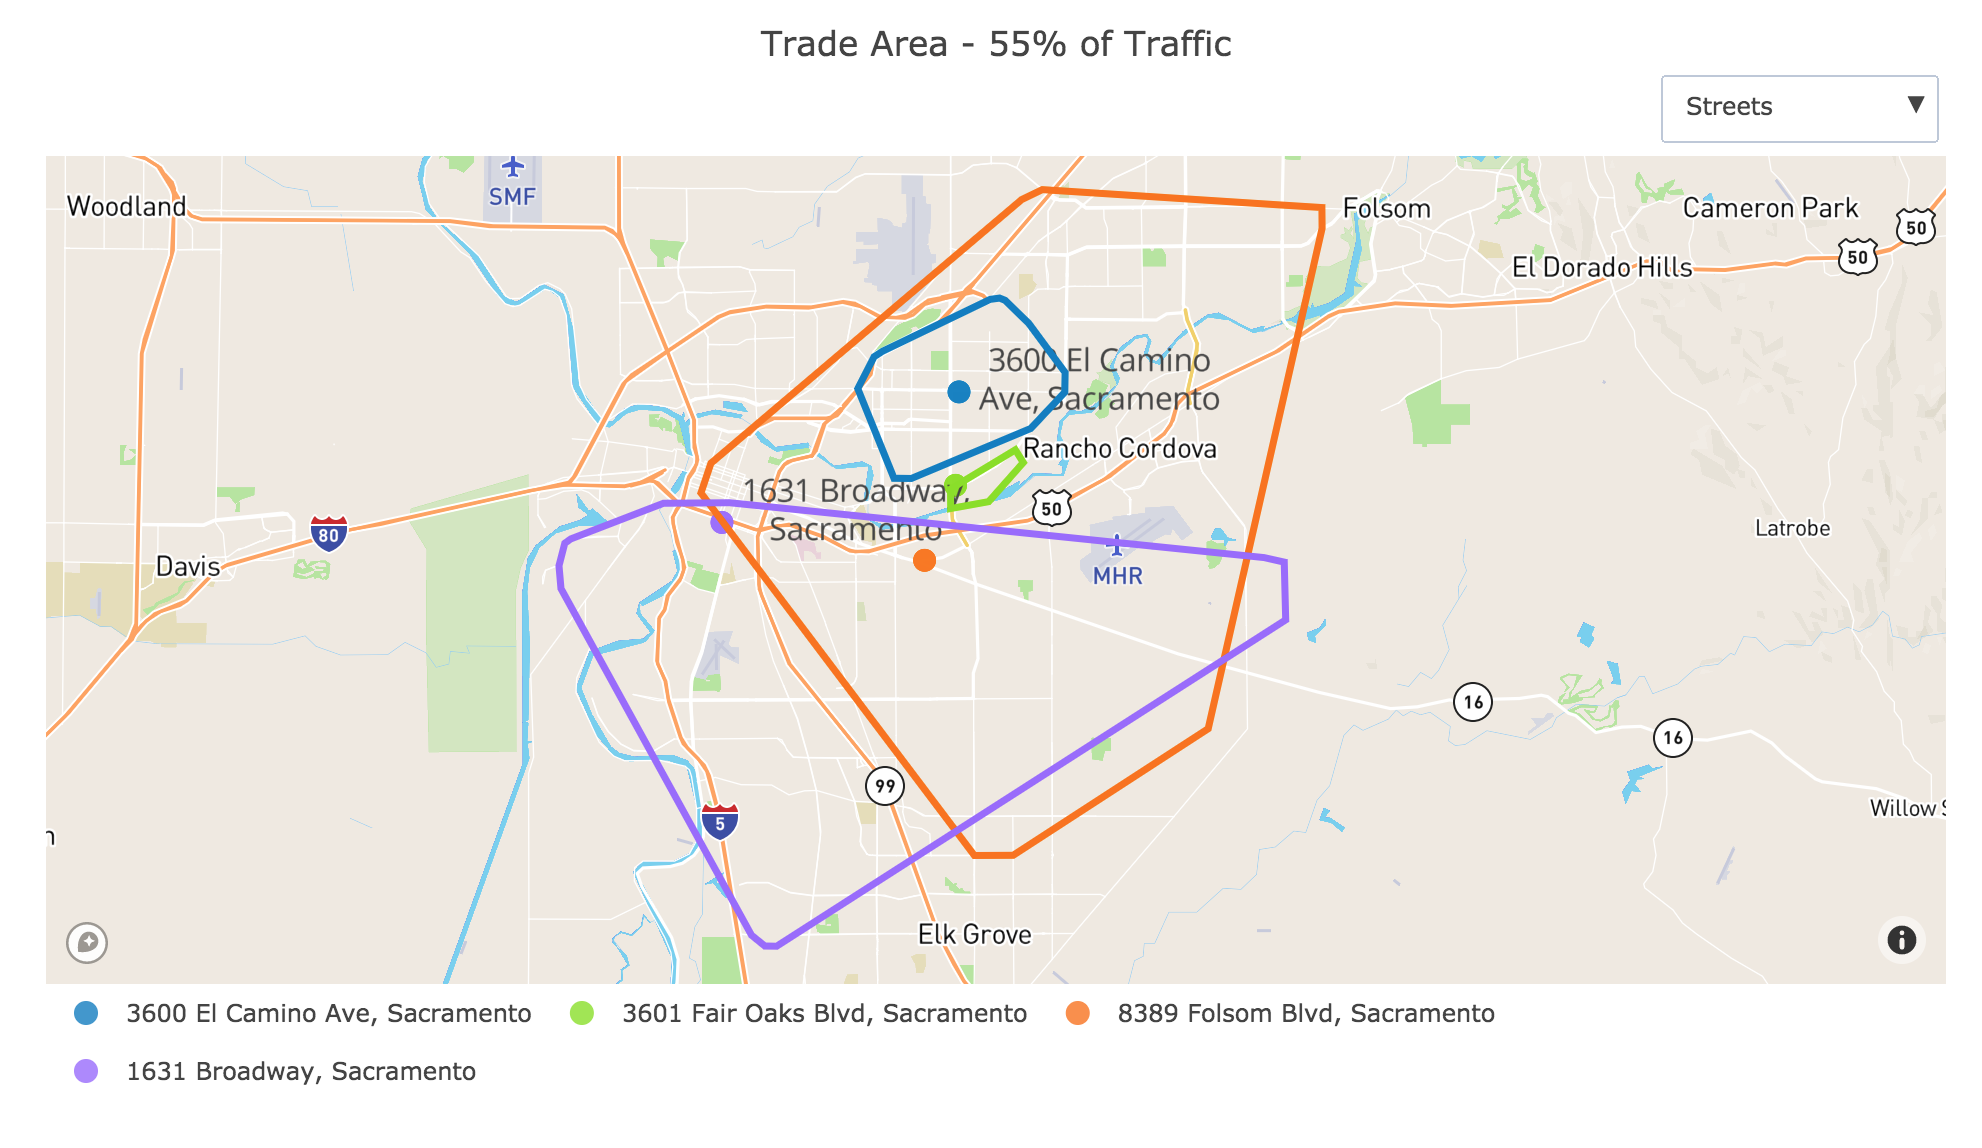
Above: Orbital Insight GO detects overlap in trade areas at Chase branch locations in Sacramento, CA.
At a subset of Chase branches in Northern California, and we saw some clear overlaps but even full overlaps between the branch on 8389 Folsom and 2 other branches 3600 El Camino Ave and 3601 Fair Oaks Blvd locations in Sacramento. Orbital Insight’s cross-AOI analysis can reveal further shopping behaviors to understand what percent of traffic is unique to each branch.
Avoiding the Red Oceans Ahead
You can imagine the growth and overlap of trade areas as you analyze 100% of customer visitation rather than the closest 50%.
Orbital Insight GO is also capable of overlaying Cross-AOI analysis to quantify the Venn diagram of cross-shopping behavior and customer revisit. A poor site selection decision can lead to a red ocean of reduced sales volumes, reduced revenue, and reduced market share.
In many cases, we see this trade area cannibalization, not from competitors but chains expanding their own store footprints.
Recommended for You
-


Jan 21, 2020
Building Footprint Comparison in Cambodia: Orbital Insight and OpenStreetMap
Learn More -


-

