


- Orbital Insight Blog
- Dorian’s Destruction of the Bahamas seen by Orbital Insight via ESRI
Blog
Dorian’s Destruction of the Bahamas seen by Orbital Insight via ESRI
As the world continues to vacillate over the exact devastation to the Bahamas from Hurricane Dorian, Orbital Insight’s land use classification algorithm and pre- and post-storm imagery shows the destruction of buildings in the Commonwealth of the Bahamas, right down to individual structures.
To visualize the interactive data in ArcGIS, click here.
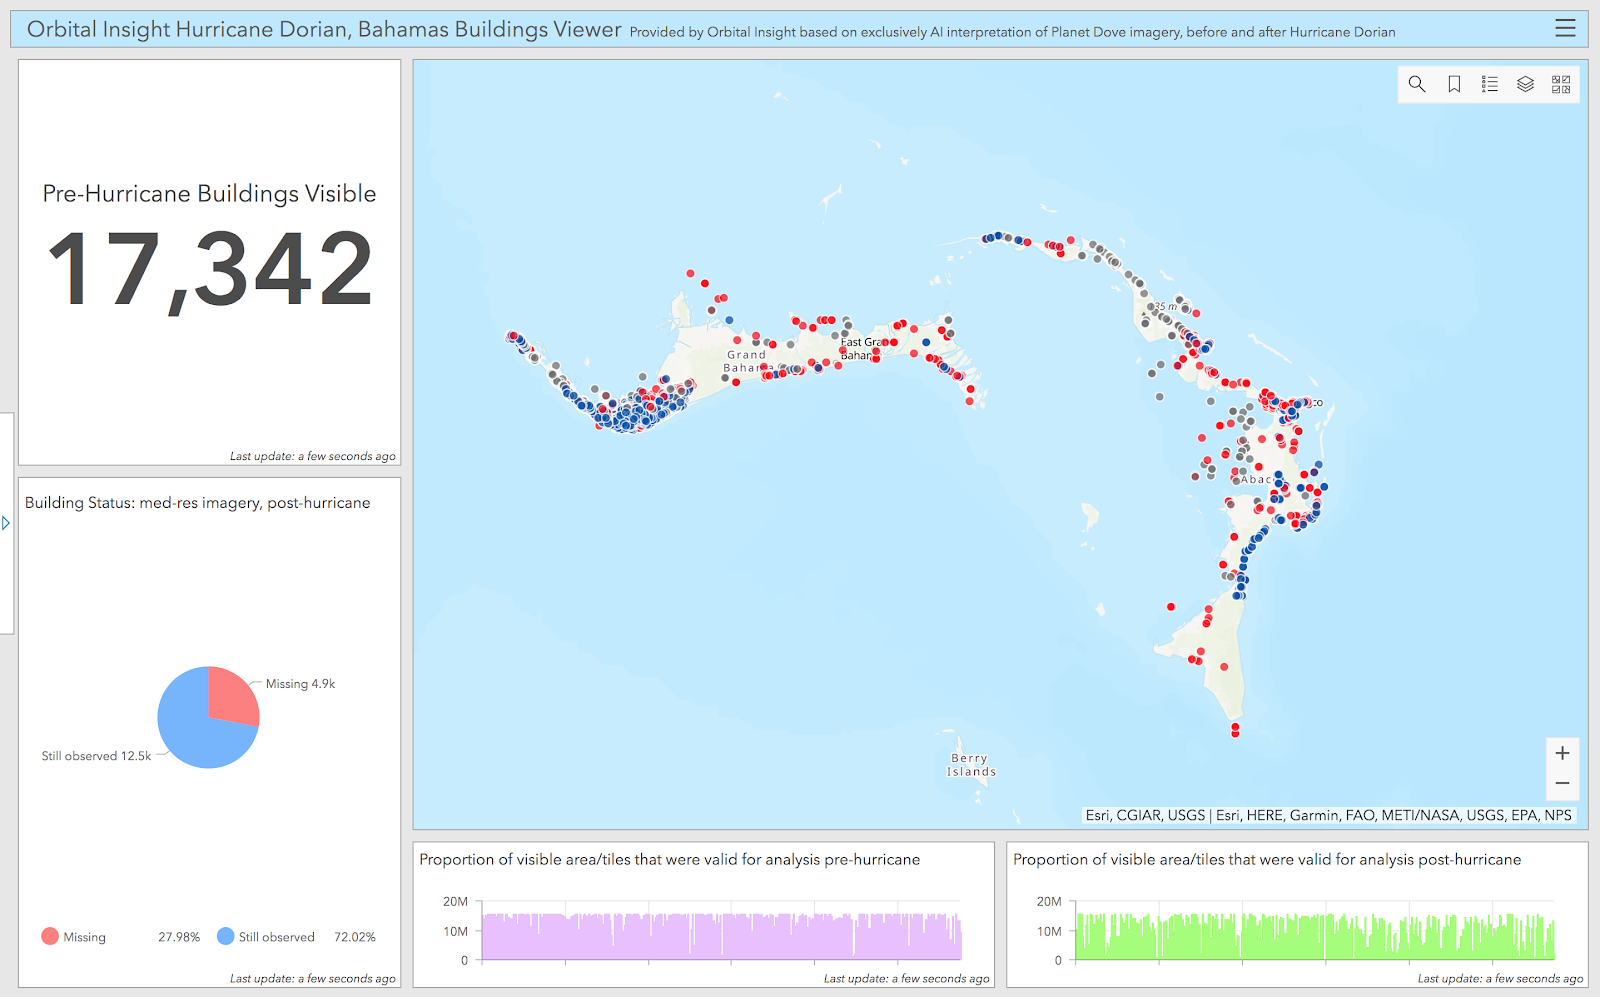
Dorian’s destruction of the Bahamas seen by Orbital Insight via ESRI
Orbital Insight observed almost 28% of the buildings destroyed on the islands of Abaco and Grand Bahama, or almost 5,000 individual structures.
Dorian made landfall in the Bahamas as a Category 5 Hurricane on Sept 1, with wind gusts of up to 185 mph. According to eyewitness accounts and aerial imagery, the Abaco Islands and Grand Bahama were two of the worst-hit territories in the storm. While Prime Minister Hubert Minnis put the death toll so far at a modest 43, he also said an astounding 1,500 people were still missing.
Orbital Insight allows anyone to visualize and quantify the damage in Dorian’s trial by feeding our data directly into ESRI’s ArcGIS tool, which combines imagery and artificial to uncover the unseen after a disaster. The tally updates based on where your screen is viewing.
Geospatial analytics empowers policymakers and first responders to deploy emergency resources as effectively as possible by rapidly providing a 30,000-foot view. When paired with data collection on-the-ground, geospatial analytics can complement and amplify traditional sources of information.
(Above: Orbital Insight integrates land use classification conducted on Planet 3–5m resolution imagery to visualize damage assessment from Hurricane Dorian at scale. Visualization by Orbital Insight in ESRI ArcGIS.)
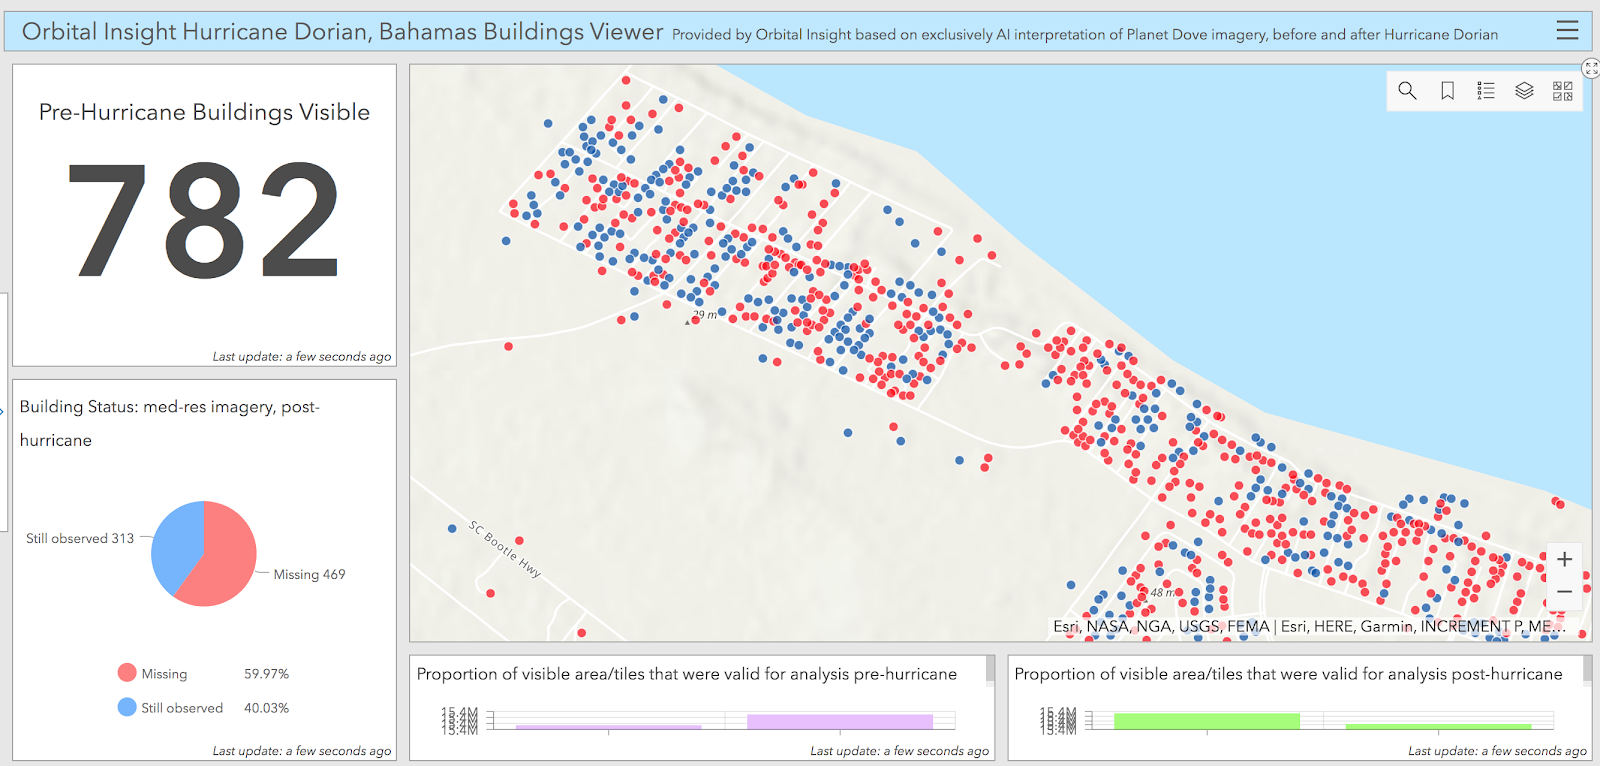
Showing the proportion of visible area/tiles valid for analysis both pre- and post-hurricane, you will see “Red Buildings” (observed before the storm, and missing later); “Blue Buildings” (visible before and after the storm); and “Gray Buildings” (observed before the storm, with status unknown thereafter, primarily due to cloud-obstruction from immediate hurricane aftermath).
In the case of Abaco, from 4,039 buildings spotted before the hurricane, there are just about 1,800 visible, with the balance 2,200 unaccounted for.
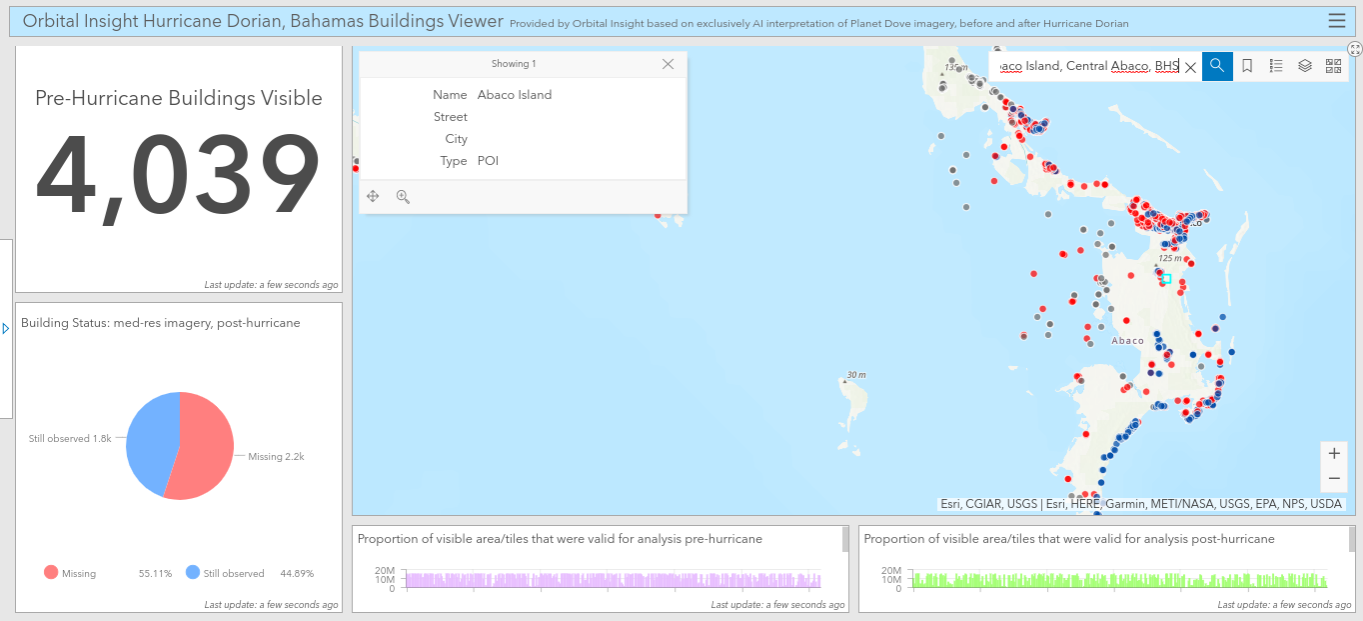
Damage assessment on Abaco, Commonwealth of the Bahamas, visualized in ArcGIS.
With Grand Bahama, from 12,806 buildings present before Dorian, an estimated 2,300 are missing.
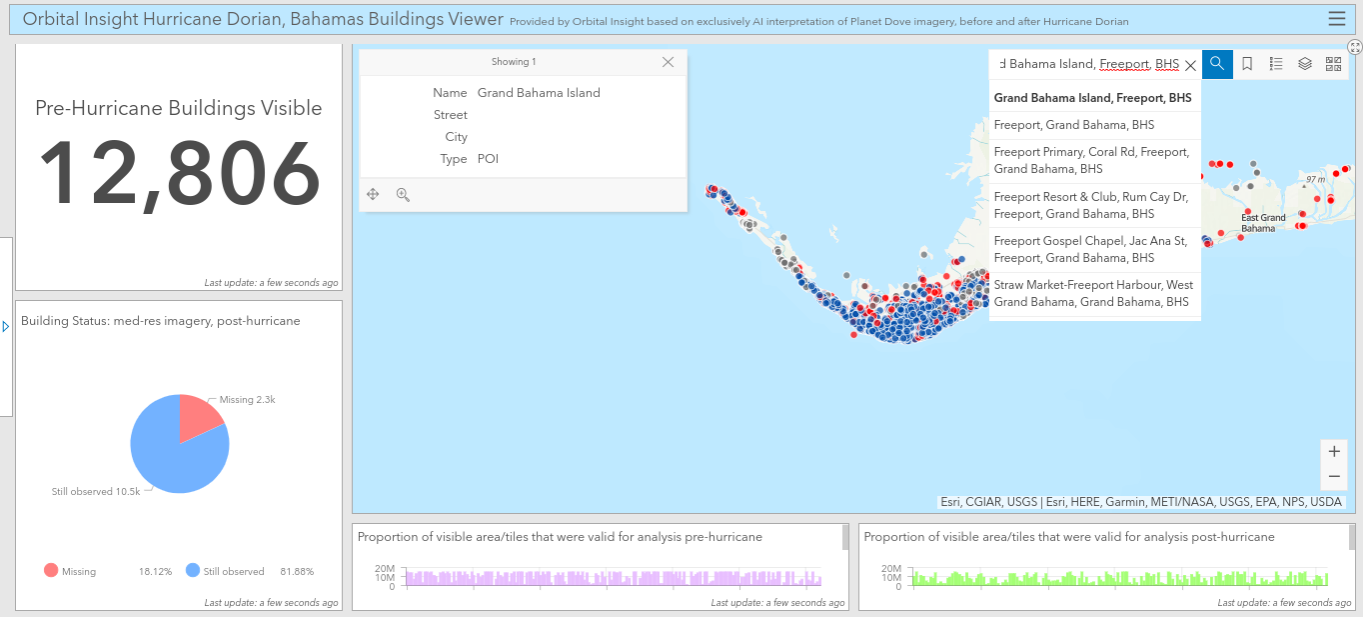
Damage assessment post-event on the island of Grand Bahama, visualized in ArcGIS.
Tailoring our algorithms to high revisit sources like these — as opposed to infrequent sources or inconsistently dated wide area mosaics — allows us to reliably conduct analyses like these on a rolling basis, and/or around a bespoke trigger event (as is the case here).
We can ensure that pre-event assessments are as up to date as possible, and that post-event assessment is conducted as close to real-time as possible.
The pre-hurricane building locations across the Bahamas attributed with assessed post-hurricane status (and viability for analysis), are based on Orbital Insight’s exclusively automated/AI analysis of Planet Dove imagery; are updated as new observations are detected. Building Footprints were also provided as an optional rendering layer.
We do acknowledge loss of footprint fidelity due to 3–5 meter resolution, compared to higher-resolution source derivations.
In addition to the building renderings (centerpoints default, and optional footprints), we are also providing two feature layers that depict where cloud-free imagery was available both before and after the hurricane. We’ve also provided dashboard links to the Esri Feature Layer versions of these, so ArcGIS users can load them into their own Esri Online maps and projects.
To visualize the data, please visit Orbital Insight’s ArcGIS visualization.
Recommended for You
-


Sep 18, 2019
Using GO to Observe the Operational Status of Suspected Chinese “re-education” Camps
Learn More -


-

Dec 19, 2018
Artificial Intelligence Helps Distinguish the Forests from the Trees (Part 2)
Learn More
Dec 11, 2018
Artificial Intelligence Helps Distinguish the Forests From the Trees (Part I)
Learn More