


- Orbital Insight Blog
- GO Consumer Takes OEM Transparency From 0 to 60 with Autos Monitoring
Blog
GO Consumer Takes OEM Transparency From 0 to 60 with Autos Monitoring
In July 2018 Orbital Insight's proprietary computer vision and artificial intelligence to count years of historical inventories at Tesla's Lathrop distribution center using satellite imagery.
The methodology determined Tesla's "factory gate" to be a seasonal trend at the facility rather than flagging demand. In July 2019, Orbital Insight puts the power of objective, transparent and timely geospatial analytics directly in your hands -- monitoring auto production at Tesla and eleven other manufacturers -- this time on a daily basis. That's up to fifteen days ahead of market alternatives.
The autos data feed is the latest in our GO Consumer product, a subscription data feed, and the newest sector rollout under the GO product umbrella, which aims to deliver full economic global transparency. It gives subscribers a sweeping view of U.S. auto production at a high level, and zoom into specific OEMs and plants, giving you production trends for each model.
Whether you're seeking macroeconomic indicators, supply chain transparency, or developing an investment thesis on an autos stock GO Consumer gives a decisive edge.
12 U.S. Auto Manufacturers, 42 Plants On Our Watch
GO Consumer now monitors 12 auto manufacturers and their 42 plants in the U.S. on a daily basis. Our list includes the Big Three – General Motors, Fiat-Chrysler, and Ford – as well as majors like Toyota, Nissan, BMW, Mercedes, Honda, Kia and Tesla.
These twelve manufacturers represent over 90% of domestic auto production.
Workforce Trends at Each Auto Plant
Orbital Insight's data scientists normalize raw location device pings at the plant level, transforming noisy geolocation data from 800 million anonymized and aggregated devices into an actionable signal. The end result is a daily view into workforce trends, directly corresponding to the number of produced vehicles which is immediately made available to subscribers.
By deploying the same empirical measurement technique at each plant we observe, GO Consumer delivers a consistent and reliable production number -- not an analyst estimate.
Monitoring Total U.S. Auto Production
Orbital Insight's data is backtested against comparable sources of ground truth so you can deploy geospatial analytics with confidence.
Our production estimates covering all 42 U.S. autos plants have a 0.76 correlation with the monthly Domestic Auto Production (DAUPNSA) data that predict how many vehicles will be assembled in the U.S. ahead of monthly US Bureau statistics.
Subscribers are able to observe major indicators of U.S. economic health before their peers.
Autos Equities Investing
Inform your financial models with the latest auto production estimates, leading official numbers by days to even months. Orbital Insight's production estimates at U.S. Nissan plants have a 0.81 correlation with the company's official unit production, which they release on a monthly basis.
While monthly reporting is rare, GO Consumer customers enjoy an even greater time advantage for the majority of manufacturers that release quarterly production data.
Tracking Plant Operations, Disruptions and Restarts
GO Consumer can detect automobile product trends down to the plant level, revealing enormous data and depth of insight into operations. For example, at Toyota's Mississippi plant, we detected overtime shifts beginning on Saturday March 30th, corresponding with the company's 12th generation Corolla production schedule. As the overtime only occurs on weekends, investors gain a potential indicator that the plant could be near full-capacity on weekdays.
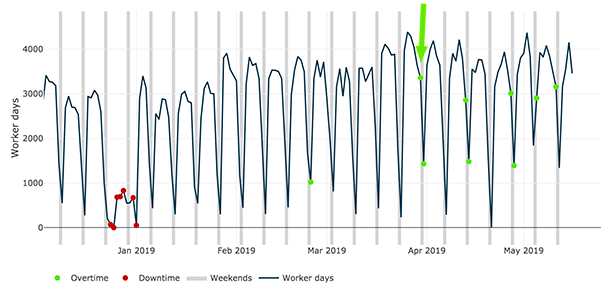
The data feed will also detect plant downtime, disruptions and restarts allowing subscribers to accurately forecast revenue lost from each day of missed production.
Efficiency Benchmarking
GO Consumer gives subscribers an objective pulse of auto manufacturing operations, offering a second diagnosis from company management. Orbital Insight compares workforce trends to production numbers in order to deliver accurate, ongoing efficiency benchmarking.
For example, we looked at Tesla's workforce efficiency, the number of cars produced per employee, showing major improvements through Q4 2018 before, while still lagging behind the industry average.
An analysis of industry peers can reveal fundamental data into an OEM's operations.
Just the Beginning
As we expand the GO's coverage in our mission to monitor the global economy, GO Consumer will also add Recreational Vehicles to its growing list of coverage, monitoring the production at companies such as Thor, Polaris, Mastercraft and Malibu.
With Orbital Insight's GO data, these comparisons within the Consumer sector and across industry peers can be pulled up with just a few clicks, providing stunning depth to your analysis.
Contact sales@orbitalinsight.com to begin monitoring all 42 covered autos plants.
Recommended for You
-

May 26, 2022
In Southeast Asia’s Oil Palm Fields, Orbital Insight Teams with Unilever to Fight Deforestation
Learn More
Aug 25, 2021
Do you recognize the top 7 trends shaping supply chain management in 2021 and beyond? (Part 2)
Learn More -

Aug 10, 2021
Do you recognize the top 7 trends shaping supply chain management in 2021 and beyond? (Part 1)
Learn More
-

Nov 21, 2019
Cellphone Geolocation Offers Insight into Refinery Activity (or Lack Thereof)
Learn More