


- Orbital Insight Blog
- Orbital Insight GO Tracks America’s Fuel and Petrochemical Supply Chain
Blog
Orbital Insight GO Tracks America’s Fuel and Petrochemical Supply Chain
The U.S. midstream infrastructure for hydrocarbons — involving a web of integrated pipelines, ports and waterways, railroads, roadways and storage facilities — is essential for moving America’s energy supplies and products along the supply chain from producer to manufacturer to the consumer.
Orbital Insight’s GO now maps the entire journey of America’s fuel and petroleum supply chain, tracking flows and disruptions at every juncture to deliver real-time insights to investors, traders and sector analysts making crucial business decisions and calls on the energy sector.
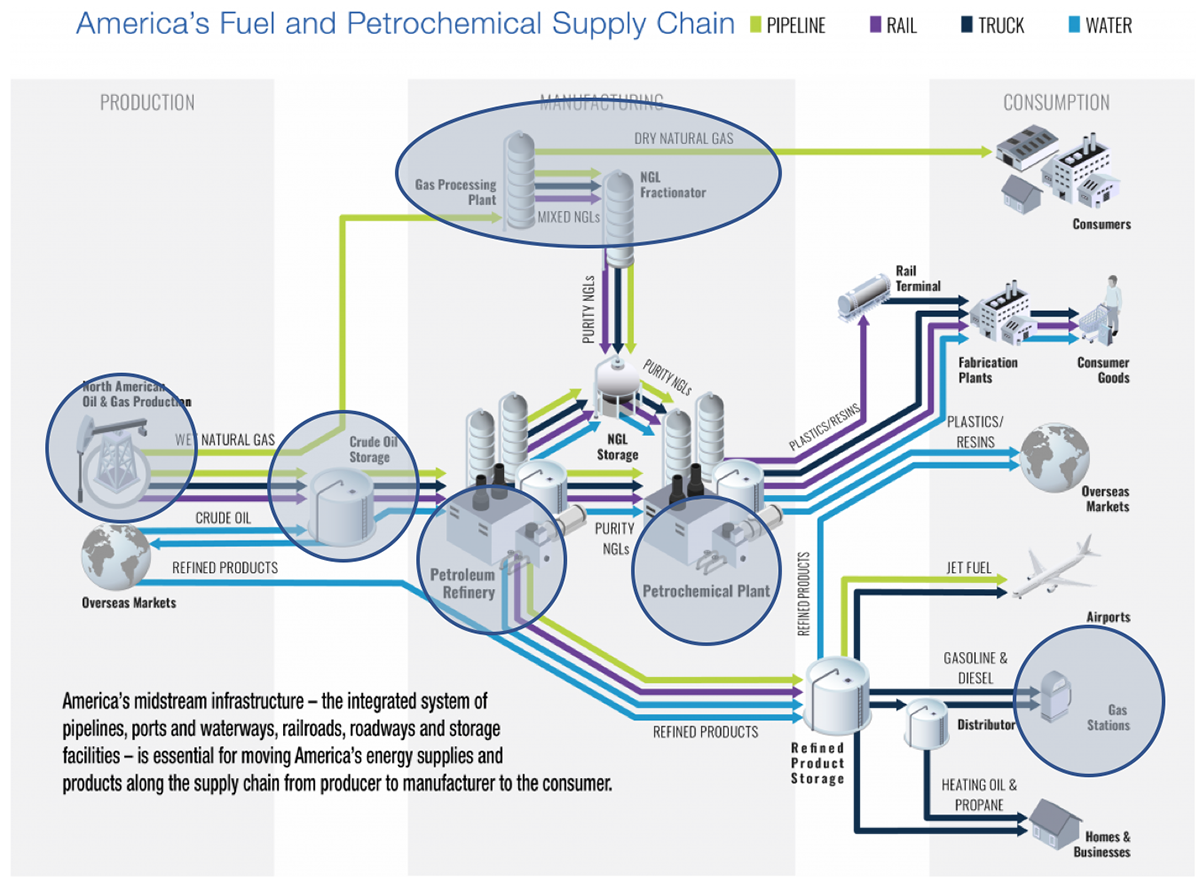
Orbital Insight GO is able to analyze commodities and facilities across production, manufacturing, and consumption. Photo credit: Site Selection.
Whether it involves pipeline, rail, truck or water-based transportation, GO’s geospatial-powered imaging and ground-based foot-traffic monitoring covers America’s energy infrastructure. Customers simply select, draw, or upload their areas of interest ranging from the size of a country down to a parking lot.
The U.S. fuel and petroleum supply chain begins with drilling on the field that draws crude oil and wet natural gas from the ground.
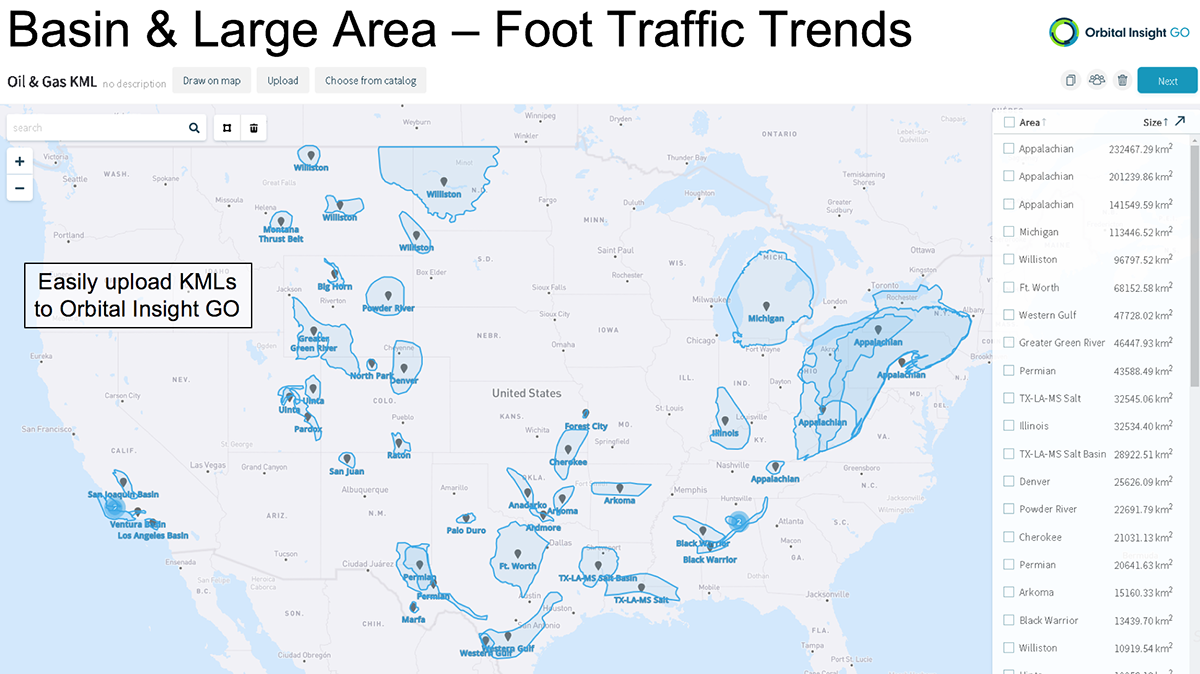
The image above shows GO’s area of interest (AOI) selection at key fracking fields across U.S. shale oil basins. Users then can apply Orbital Insight’s algorithms to monitor foot traffic, vehicle counts, and land-use change at scale.
The crude that’s drawn is transported to storage tanks, from where it is taken out either to be refined domestically or shipped to refineries overseas. During the refining process, the crude gets turns into products such as jet fuel that gets stored at airports; gasoline and diesel that’s delivered to pumps and heating oil and propane that finds its way to homes and businesses.
Some of the crude gets piped to petrochemical plants to be turned into plastics and resins. Petrochemical plants also mix crude with other energy derivatives, turning them into specialty raw materials that certain fabrication plants need for turning out consumer goods.
Geolocation data from Orbital Insight over a Google Basemap of Motiva Enterprises’s Port Arthur Refinery in Texas. Location Intelligence can reveal facility anomalies such as unplanned maintenance and outages.
Moreover, Orbital Insight’s GO platform can be used for other energy assets & processes too — including frac pads, NGLs, agri-chemicals, inter-modal transport, and more.
GO’s geospatial-powered satellite imagery can also track activity in any customized Area of Interest (AOI). This is particularly useful for clients seeking insights on construction activity at “frac pads” that serve as platforms for the drilling or fracking process that extracts oil and gas from the ground.
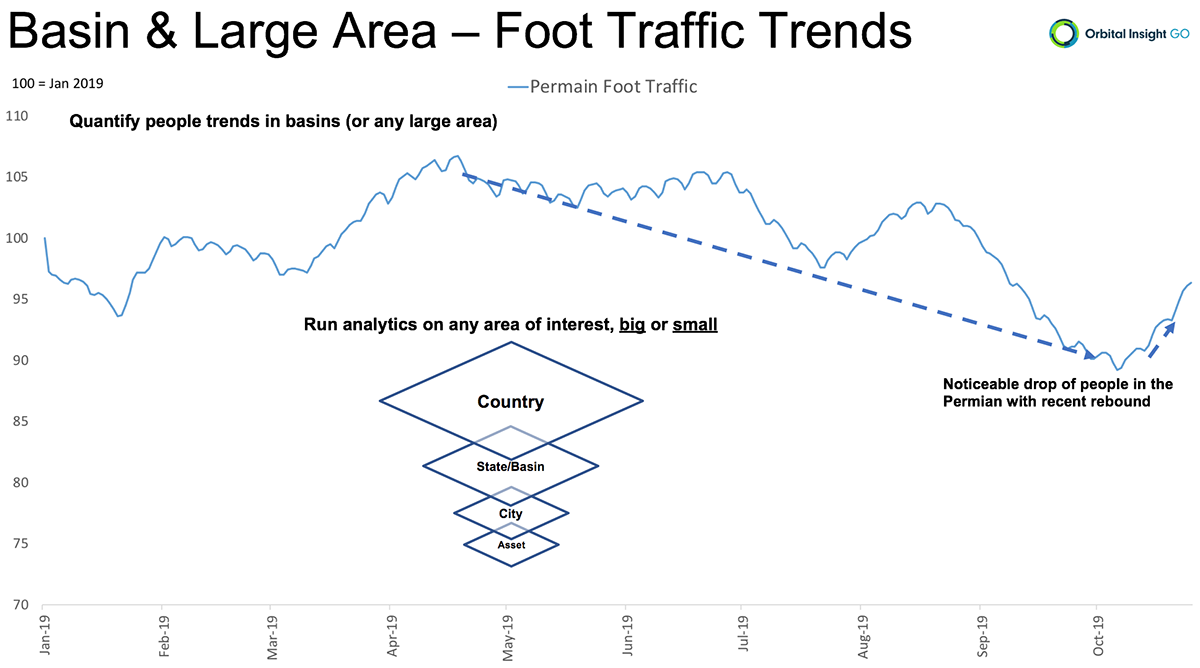
Orbital Insight GO detects foot traffic trends in the Permian Basin, demonstrating the ability to quickly, efficiently, and economically monitor large areas to tip-off further research.
In the above charge, GO’s data output zooms in on foot traffic trends at the Permian Basin. Note the relative drop in foot traffic beginning earlier in 2019. The steady slide in foot traffic since the summer of this year may have been a leading indicator of the rapid shutdown of drilling rigs in recent months as drillers tried to preserve capital amid softening energy prices.
Orbital Insight GO allows users to create quick, accurate, and efficient data to monitor infrastructure projects within hours. In the coming weeks, we will show how geospatial data can not only track inventory flows, facility anomalies, and demand indicators but how our customers can connect the dots and trace a living breathing supply chain.
For more information on how to use Orbital Insight GO to illuminate the entire energy supply chain, please reach out to: support@orbitalinsight.com
Recommended for You
-

May 26, 2022
In Southeast Asia’s Oil Palm Fields, Orbital Insight Teams with Unilever to Fight Deforestation
Learn More
Aug 25, 2021
Do you recognize the top 7 trends shaping supply chain management in 2021 and beyond? (Part 2)
Learn More -

Aug 10, 2021
Do you recognize the top 7 trends shaping supply chain management in 2021 and beyond? (Part 1)
Learn More
-

Nov 21, 2019
Cellphone Geolocation Offers Insight into Refinery Activity (or Lack Thereof)
Learn More