


- Orbital Insight Blog
- Return on Rollercoasters: Big Data and Theme Park Investing
Blog
Return on Rollercoasters: Big Data and Theme Park Investing
Amusement parks are quintessential to American recreational life; they are quite literally the biggest form of fun in the United States. People expect their theme parks to be merry, exuberant and brash, where cotton candy and hotdogs mix with rides that range from the gentle giant Ferris wheel to the terror-striking Typhoon.
But while pleasure, awe and terror are all part of the mix, thrill-seekers also want their playlands to be predictable and safe, and are happy to stay away when these places have to close for emergencies, such as inclement weather.
For park owners preparing to batten down the hatches before a storm, a comprehensive overview of people movements within their grounds and periphery – and how these might change in the run up to the disruption, during the closure itself and on reopening – can be invaluable.
While lost earnings can be deduced from average sales in any period, these don't give an insight into audience demographics, their consumer bases and how such data may be constantly evolving. Having access to such matrix would help park owners and their investors better understand daily activity, and craft more impactful marketing strategies for the future.
With Orbital Insight, these are now possible.
What We Do
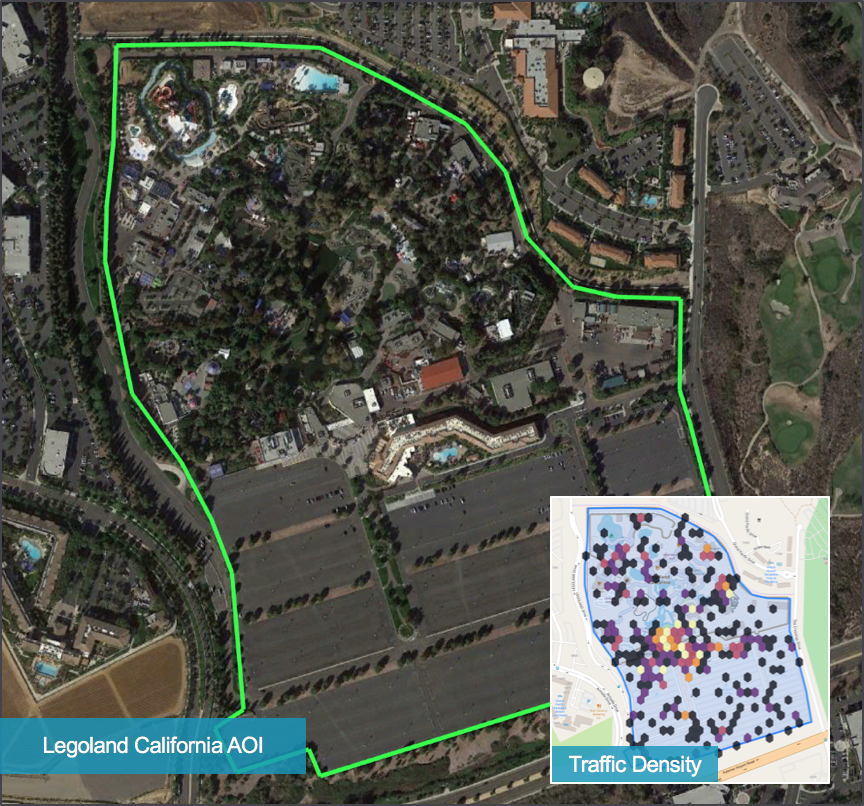
At Orbital, our use of geospatial analytics, satellite imagery and location pings from electronic devices enable us to study foot and vehicular traffic in any geo-fenced commercial area of interest (AOI). We can monitor amusement parks not just for interruptions and closures, but also opening day crowds, business during expansions and promotions and periods of decline.
To showcase our expertise – which cuts across industries such as retail, automobiles and oil and gas – we applied our technology to study specific events that occurred at two theme parks under the Legoland chain run by U.K. based Merlin Entertainments.
Our analysis specifically focuses on the Legoland California Hotel's expansion in April 2018, and Legoland Florida, where an interruption caused by Hurricane Irma occurred in September 2017.
Legoland Florida & Hurricane Irma
Legoland Florida, which opened in October 2011, is the group's second largest theme park in the United States. It is also the second largest Legoland park after Legoland Windsor.
The park was built on the former site of Cypress Gardens, a historically famous Florida theme park and is divided into 13 areas identified by the Lego world and its characters: The Beginning, Fun Town, Duplo Land, Miniland USA, Kingdoms, Pirates Cove, Imagination Zone, Technic, Land of Adventure, Lego City, Chima, LEGO Friends, Ninjago, and a restored replica of Cypress Gardens.
In 2017, the park was closed for three days from September 9 as Hurricane Irma approached Florida as a Category 5 storm with windspeeds of 180 mph. Park officials said they couldn't guarantee guests with resort amenities or access to electricity during the adverse weather.
Device counts
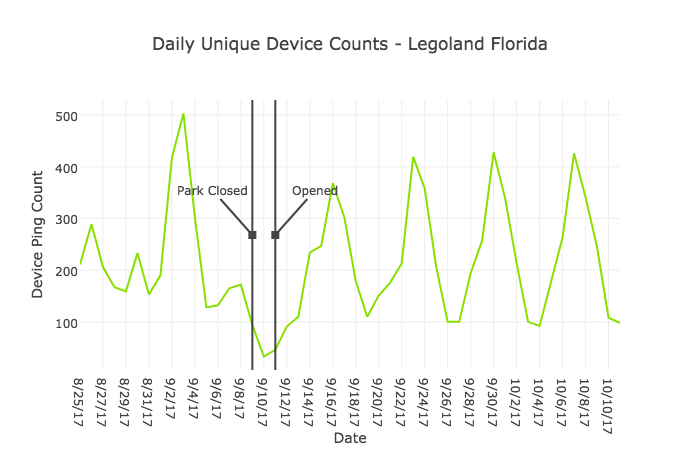
It appears Legoland Florida was active on September 8, 2017, before being closed on the 9th through 11th, reopening on the 12th.
Our device counts at Legoland Florida show the reading reaching a peak of 503 on Sept 3, a weekend.
From there, it fell back to just above the baseline, picking up to 172 on Sept 8 before its closure. In the three subsequent days, device counts fell below the baseline. The reading rebounded soon after the park reopened, hitting 368 on Sept 16, two Saturdays later. From there, each subsequent weekend, device counts hit above 400.
Legoland California
Operating since March 1999, this like any the group's theme parks is based on the Lego world.
Legoland California has nine sections, namely: The Beginning, Explorer Island, Heartlake City, Fun Town, Castle Hill, Miniland USA, Imagination Zone, Pirate Shores, and Land of Adventure. A Sea Life aquarium is also adjacent to the main theme park.
In 2010, a water park opened on its grounds, one of the only three at Legoland parks, with the other two being in Malaysia and Dubai. In May 2014, an add-on was built for the water park, themed after Legends of Chima.
For this analysis, we track activity around the opening of the new Legoland Castle Hotel on April 27 this year.
Device counts
These charts show the cumulative number of daily unique pings for the week ending June 12 of 2017 and 2018. They were segmented by Legoland California as a whole, the Legoland Hotel, and the newly opened Legoland Castle hotel. Both hotels boast 250 rooms of capacity. The new Castle Hotel has yet to reach occupancy rate comparable to the Legoland Hotel.
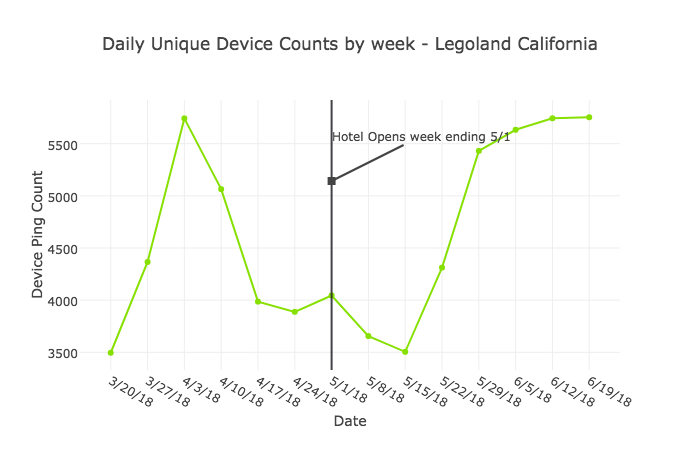
Device counts for Legoland California as a whole peaked at 5,742 on April 3 this year. On the week ending May 1, during the opening of the new Legoland Castle Hotel, the reading was at 4,045. Two weeks later, it had fallen to 3,505. From there, it begin ascending without stop to reach a new peak of 5,753 by the week of June 19.
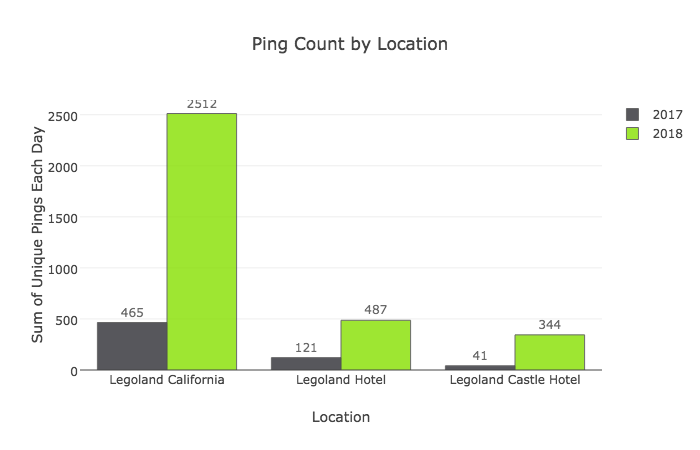
On a comparable basis, we're not seeing the new Legoland Castle Hotel match the occupancy of the original Legoland Hotel.
Legoland Demographic Analysis
Leveraging demographic analysis on visitors of Legoland California and Legoland Florida with cell phone geolocation data, Orbital Insight can count and profile consumers who visit specified locations. In this analysis, the two Legolands in California and Florida were studied over 2017 and 2018.
Resulting aggregated trends in demographics through our geolocation data can enable automated analytics and trend monitoring to:
- Identify shifting demographics in consumer bases.
- Provide insight into marketing audiences and potential consumers.
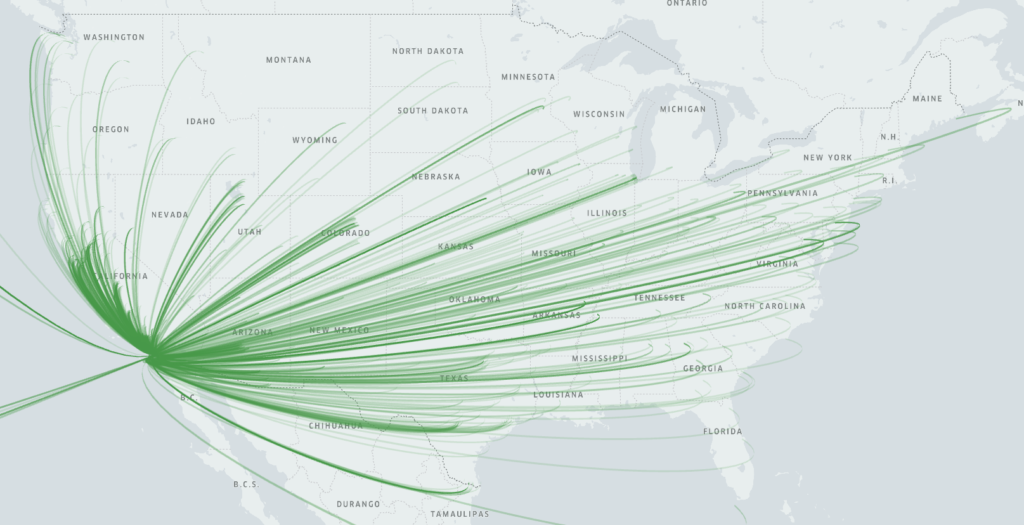
Each Legoland was marked as an AOI to detect geolocation pings. Each unique ping per day was then joined to census block group data from the 2015 American Community Survey 5-year estimates allowing for demographic insight into visitors of the tournaments.
Analytical Examples and Highlights
With geolocation data joined with census data, Orbital Insight can profile as well as detect changes in demographics of visitors between theme parks throughout time. The following examples highlight capabilities of this process but, is not limited to the following metrics.
Median Income
Median Income of visitors' home census block for both parks have decreased and are regressing to the U.S. Median income of $53,889. This shift is supported by the percent of population under the poverty line and population with at least a Bachelor's Degree, shown in the following charts. Holding the number of attendees constant, this may cause a decrease in average revenue per visitor.
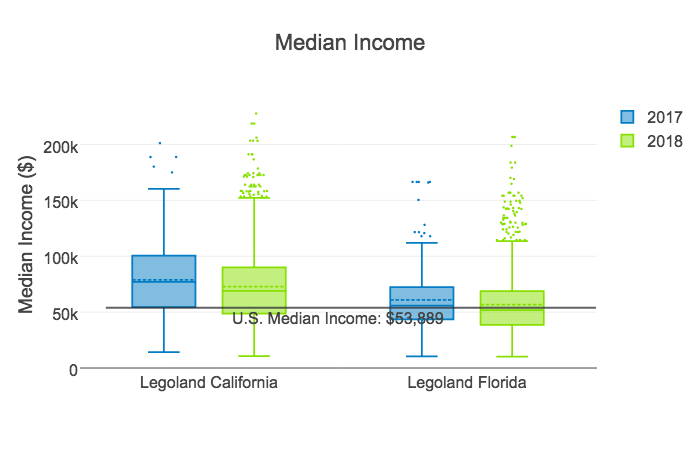
For Legoland California, the middle two quartiles of visitors in 2017 had a median income of $54,394 to $100,565. The lower end of that was just above the U.S. median income of $53,889.
This year, however, the middle two quartiles of visitors to Legoland California were found to have a median income between $48,492 and $98,138 – lower than the previous year.
For Legoland Florida, the middle two quartiles income of its majority client group went from the $43,456-$72,491 bracket in 2017 to $38,601-$68,787 this year. The lower end of that was significantly below the U.S. median income of $53,889.
The two sets of numbers clearly show that the majority of visitors to both parks had lower incomes this year compared to a year ago. But if the customer capture rates do not fall, then they also indicate the enduring popularity of both with their target groups, and this could be due to promotional efforts that have retained their appeal.
Footnote:
Orbital Insight can monitor theme parks for hurricanes and other natural disasters, as well as major events. Whether you're owner or investor in a theme park, our analysis will help you better perceive the causal effects and impact of such events that could lead to more intelligent business decisions and greater understanding by the media and public.
Recommended for You
-


Jan 21, 2020
Building Footprint Comparison in Cambodia: Orbital Insight and OpenStreetMap
Learn More -


-

