


- Orbital Insight Blog
- Understanding Development Trends through Updated Parcel Data
Blog
Understanding Development Trends through Updated Parcel Data
Combining Orbital Insight land use and open-source parcel data helps identify outdated parcel data or unregistered property
- A 3-step process to create land use maps, intersect against parcel boundaries, and conduct analysis is cost effective and may be completed in a matter of days.
- Governments require an up-to-date understanding of land use, development trends, and parcel data in their area. Maintaining key datasets such as road networks, buildings, and agricultural land can be expensive and time-consuming since methodology consistently differs from one locality or even department to the next. Accurate parcel data informs everything from zoning maps to tax assessment, timber management, and emergency operations.
Data from satellite imagery is a widely-used resource and often the foundation for existing datasets, updates and validation practices. However, many of these sources are often incomplete or outdated, particularly in fast-growing or rural regions. For local governments, there is a twofold challenge at work: (1) such imagery can be subject to infrequent or inconsistent collection across different regions, and (2) substantial time is required to search and annotate said imagery into usable forms of data. In rural areas, where infrequent collection leads to imagery years older than in urban cores, such imagery or derived data is rendered less usable due to uncertainty around date of collection.
To address the fundamental need for governments to catalog building, road, and other land assets in a timely way at scale, Orbital Insight has developed a land use classifier algorithm leveraging Planet’s medium-resolution imagery. Planet images every region of earth multiple times per week. By ingesting this imagery into our newly-released GO platform, Orbital Insight produces land use maps that are uniformly current across any area analyzed, regardless of urban/rural breakdown. Using proprietary computer vision techniques, users may create an inventory of buildings, roads, and other land use classes at municipal, county, state, or even country-wide scale.
Case Study: Updating Buildings and Parcel Data in Northern California
We will go through a practical use-case that demonstrates the land use algorithm as a foundational data source, and specifically its ability to contribute towards land management priorities. In this case, we combined Orbital Insight building polygons from April 2019 with open-source parcel data in Northern California. Our goal was to assess the currency and validity of parcel records, specifically those marked as “Vacant” plots and “Tree Protection Zones” (TPZ). Then we imported this data into an Esri web app, providing an intuitive self-service user interface for exploring the results of that analysis.
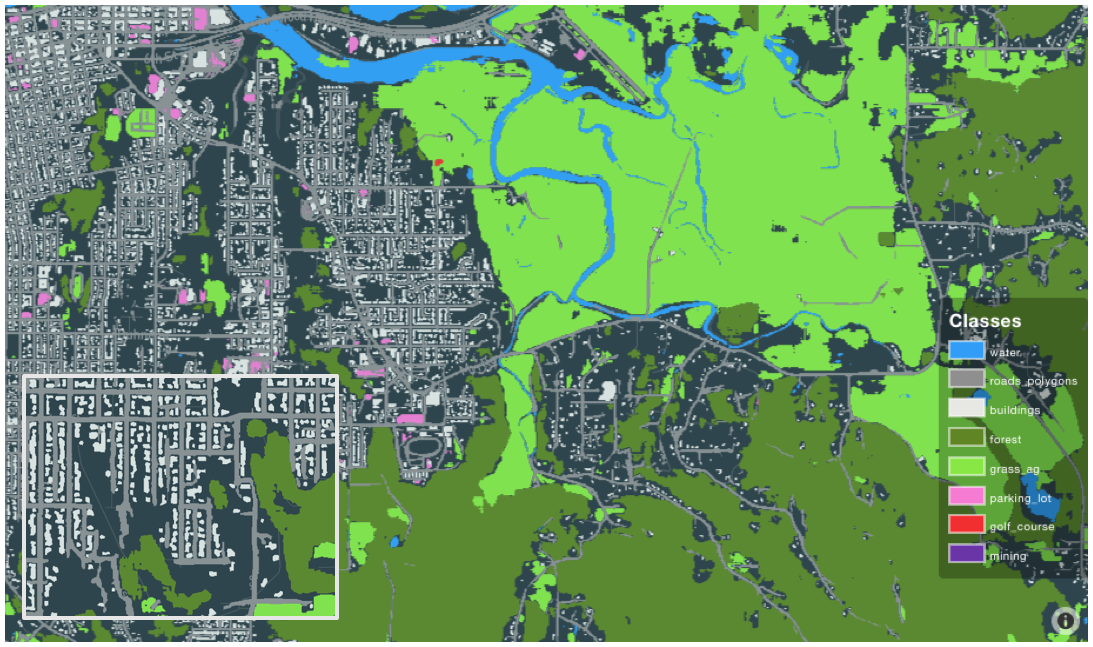
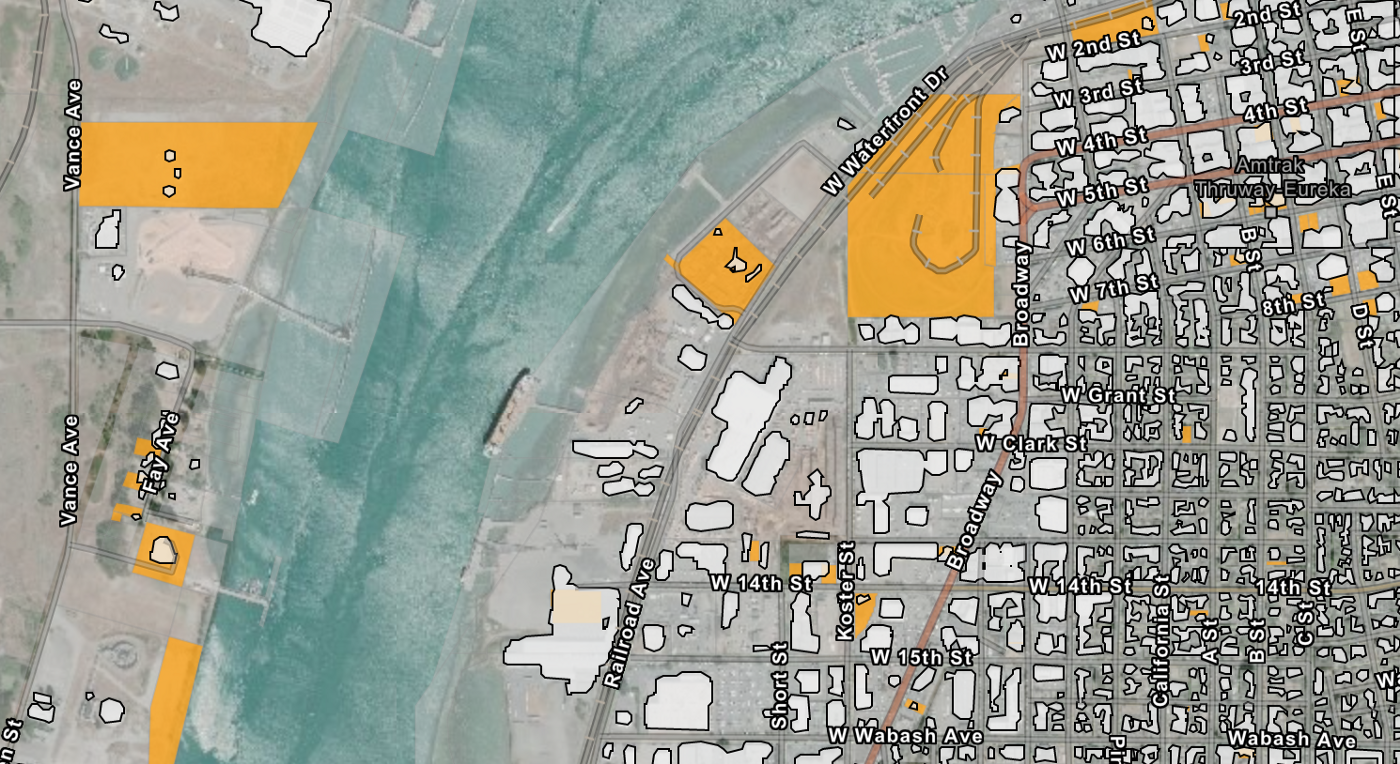
Medium-resolution land use classifier run in Eureka, CA (Apr. 2019). The results are visualized in our GO Explore tool.
Step One — Run Orbital Insight Land Use Classifier:
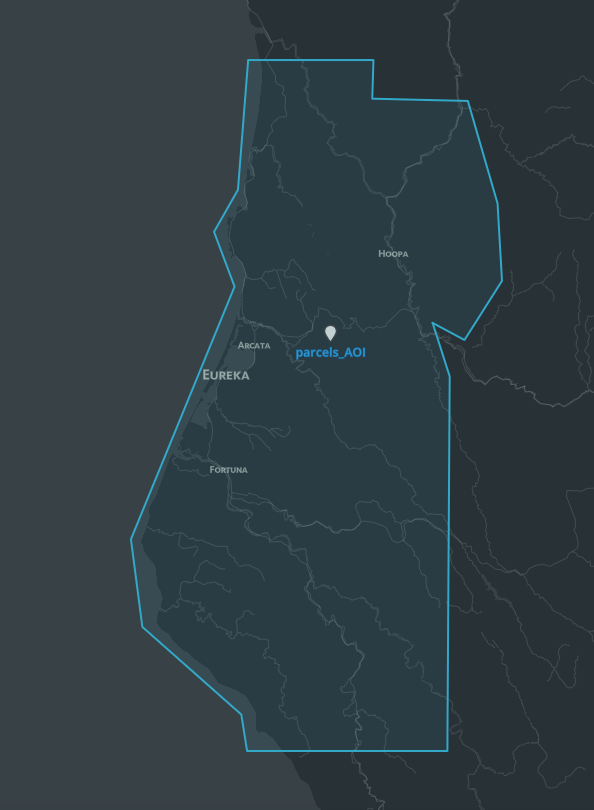
To initiate the project, we used the Orbital Insight GO Create Platform to generate building polygons from medium-resolution imagery. In this case, we drew a boundary encompassing approximately 10,000 square kilometers in northern California (Figure 2). We ingested imagery from April 2019, ensuring that the dataset was up-to-date across the entire region.
The project was initiated one afternoon, and results were ready for analysis the following day! Our algorithm selected 831 individual scenes to ensure cloud-free imagery for the entire area was available. Using imagery aggregation techniques, we scanned, annotated, and combined outputs of each individual scene to create a finished, high-accuracy, high-resolution dataset for the region nearly overnight.
Users may take a first pass analysis at the land use classifier results in the GO Explore Visualization Platform Tool, or leverage GO’s download functionality and/or API. We chose the latter and will retrieve those results in a structured geospatial data format for additional analysis using third-party parcel data.
Step Two — Analyzing Building Footprints against Parcels Boundaries:
Once the land use data was generated and retrieved, we cross-analyzed it against parcel data for the northern California region — in this case, almost 75,000 unique boundaries. Many platforms and code libraries can support the necessary spatial overlap processes that let us categorically identify which parcels have buildings on them and in what volume. These include Esri/GIS Software and Python-based programming approaches.
Preparing Parcels Data
To answer our key questions, we first flagged key identification within the parcel data, specifically whether they were marked as: Vacant, TPZ, Rural, Residential, Commercial, and/or Industrial plots of land. This let us focus on our core priority of evaluating Vacant and TPZ parcels, but opens up future, generalized analyses of land use management/records across multiple dimensions.
Intersecting Orbital Insight Land Use Data
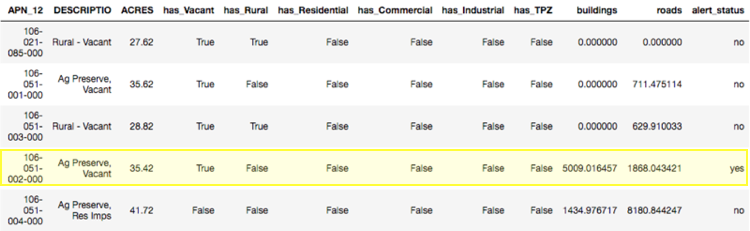
Next we used all of the nearly 75,000 individual Parcels as a geospatial “clip” against the 10,000 square kilometers of land use data, focusing on the building and road feature classes. In so doing we were able to assign additional values to each parcel entry, reflecting the up-to-date square meters of building and road footprint detected therein. Figure 3 shows an example of this in tabular format, with each row representing a Parcel based on its unique ID. In addition to the information from their original records, these now include information from the intersection with Orbital Insight’s land use — “buildings”, “roads”, and “alert_status” (flagging a Vacant parcel with buildings on it).
Step Three — Making Sense of the Results
Now that we have updated our nearly 75,000 parcels records to include up-to-date statistics on building and road land use features, we can take a variety of approaches towards making sense of it. A tabular listing of outdated parcels may be sufficient for certain use cases. Other users may want a visual depiction of the underlying data. One user-friendly option is to combine the updated parcels (from Step Two) and the Orbital Insight building data (from Step One) in the Esri ArcGIS Online Platform. Esri users can ingest these to build multi-sourced, interactive analyses, web applications and dashboards.
Interactive Dashboard
A quick glimpse at the dashboard (Figure 4) shows the location of flagged parcel data, number, and percentage of parcels in view that may be outdated. Based on our analysis, there are as many as 2,332 parcels that may require updating or show unregistered structures.
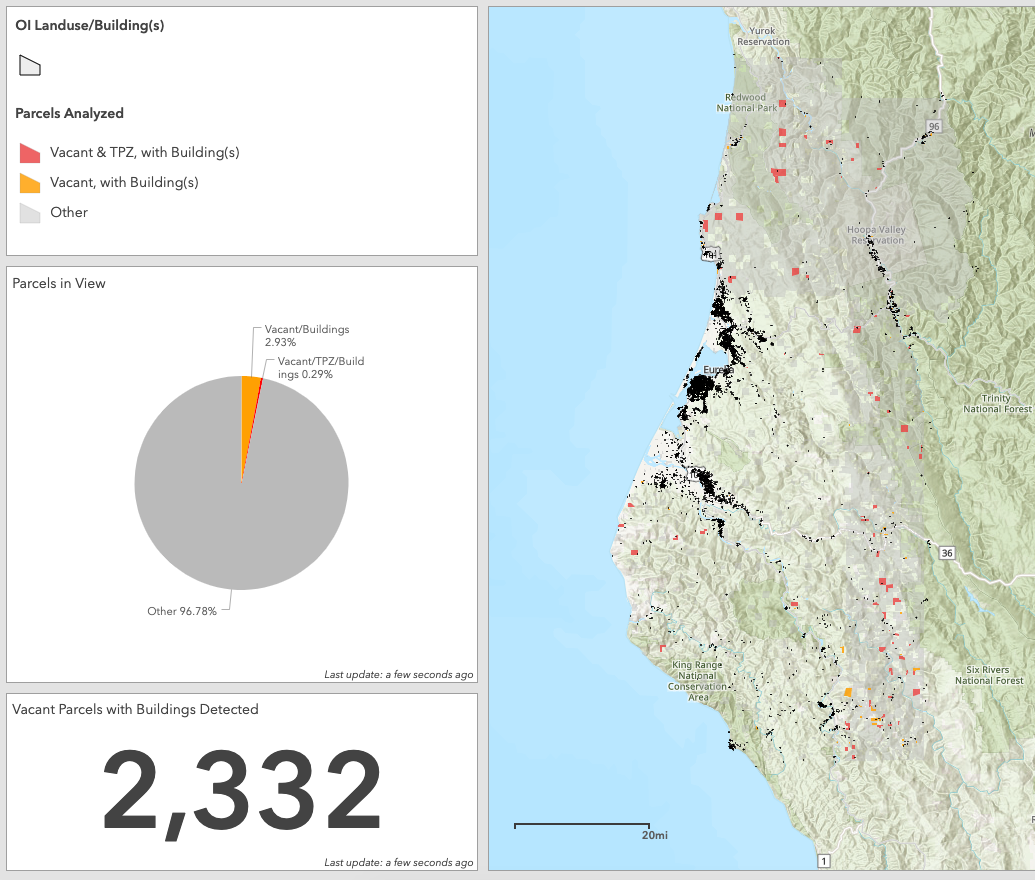
This approach flags Vacant and TPZ parcels that Orbital Insight has identified buildings in. We can also render the original Orbital Insight land use data so that users may see the actual buildings detected across the region — as seen in the two images below. Visualized over flagged parcel information, these can provide a starting point for further investigation by local authorities in the event that the building is unregistered.
Repeatable and Scalable Analysis through Automation
This type of analysis is straightforward and highly repeatable, thanks to Orbital Insight’s GO Platform and Provider Partnerships. From project kickoff to visualization in a web browser, such analysis could be completed in less than a week. To explore the following use cases in your area, please get in touch with us at Orbital Insight:
- Parcel Data Collectors: Inform parcel updating campaigns for local governments or private companies tasked with maintaining such datasets.
- Tax Collection and Law Enforcement: Identify structures that may have been previously unknown to local authorities. Prioritize future assessment efforts over large areas.
- Land Conservation Management: Gather the latest data on development in protected areas.
- Land Management and Trend Analysis: Expand to layer in additional parcel record categories and Orbital Insight analytics (cars, trucks, airplanes, mobile phone geolocation data, and more). Conduct multivariate analyses to better understand development trends and inform policy decisions accordingly.
Email publicsector@orbitalinsight.com for additional information or to set up an introductory meeting.
Recommended for You
-

Oct 28, 2019
Using Mobile Phone Geolocation Data to Understand Lower-Income Areas in Cairo
Learn More
-


Oct 22, 2018
Using Geolocation Data to Understand Consumer Behavior During Severe Weather Events
Learn More