


- Financial Services
geospatial solutions
Financial Services
Get near real-time data to back your hypotheses by monitoring broad trends in industries, regions, companies or specific activities at individual locations.
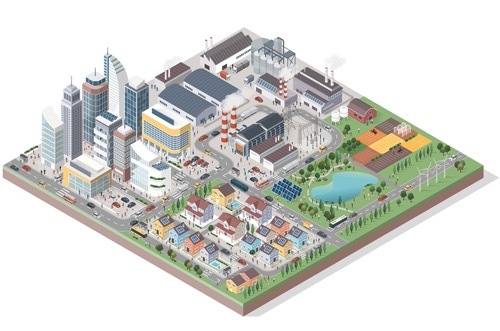
Decision makers need to understand economic activity in various sectors of the economy on a more real-time and targeted basis. Traditional sources of information like earnings reports, industry research and news are often too slow to reliably act upon and often lack the flexibility and granularity to be actionable. To make more informed investment decisions, assess risk and identify new opportunities, investors need new and reliable data sources. Whether it’s for an entire industry, region, company or even specific location.

Orbital Insight’s GO platform provides unprecedented access to near-real-time analysis of economic activity and supply chain relationships from broad regions around the world, down to individual locations like manufacturing plans, distribution centers and office buildings.
Users can use GO to search and analyze thousands of global locations from Orbital’s catalog of millions pre-defined areas-of-interest, uploading your own polygons or quickly drawing custom ones directly in the GO platform.
See more details here.

Whenever we rely on government data there is always a lag time. What we’re able to see is real-time flight activity in China, we’re able to see real-time port activity in China, we’re able to see real-time vehicle-traffic congestion data in China. This is able to give us a significant edge in terms of calling market inflection points.
What's so intriguing about what Orbital Insight is doing is they are looking at the world in real time and that allows one to make much more precise and confident predictions about the future. You're not relying on data that's already out of date.
Use Cases
Economic Activity
Analyze the economic activity in an industry, organization or geographic region to assess economic trends and the impact of external event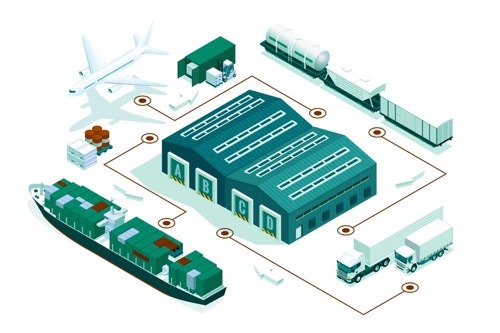
Supply Chain Traceability
Discover, map and monitor the multi-tier relationships that make up the supply chain networks that you and your competitors rely on. Uncover the logistical links between factories, suppliers, stores, and distribution facilities on a global scale.Showcases
Global economic activity can be created on any type of area of interest in minutes in GO, whether it's a specific manufacturing plant or thousands of office buildings, following three simple selections:
- WHAT type of activity (e.g. foot traffic)
- WHERE (select from catalog of millions of areas or your own custom areas)
- WHEN (historical & ongoing monitoring, dwell-time and hours-of-the-day filters)
See more details here.

Heatmaps
Heatmap showing daily foot traffic activity in New York City during the COVID lockdown.
Heatmaps can be run on small areas, like a manufacturing plan, all the way to large metro areas with user-selected resolutions.

Office Building Occupancy
Analysis of office occupancy across the united states over the last two years.
Example analysis:
- 2,700 Office Buildings in the US (sample of 300k office buildings in AOI Catalog)
- 245 Million unique visits over two years
Few hours to create in GO
Shopping Mall Visits
Analysis of shopping mall visitors across the united states over the last two years.
Example analysis:
- 1,000 Shopping Malls in the US (sample of 47k malls in AOI Catalog)
- 1.5 Billion unique visits over two years
Few hours to create in GO
Mall of America Visits
Analysis of specific shopping mall visits over the last two years.
Example analysis:
- 1 Shopping Mall (Mall of America)
- 4 Million unique visits over two years
Few minutes to create in GO
Airports, Train & Bus Stations and Offices
Analysis of airports, commuter stations and office buildings across the united states over the last two years.
Example analysis:
- 750 Airports (700 Millions visits)
- 800 Train Stations (47 Million visits)
- 500 Bus Terminals (54 Million visits)
- 2,700 Office Buildings (180 Million visits)
Few hours to create and analyze
Amazon Distribution Centers
Analysis of Amazon distribution center occupancy over the last two years.
Example analysis:
- 290 Amazon Distribution Centers
- 166 Million visits over 2 years
Few hours to create and analyze
US Refineries
Analysis of US refinery occupancy over the last two years.
Example analysis:
- 140 Refineries
- 10 Million visits over 2 years
Created by Orbital professional services, an hour to run and analyze
Get the Data Edge
Having the best data is paramount in finding the best opportunities. Whether that means finding the diamond in the rough or avoiding fool’s gold. Is your intel complete? Up-to-date? Bias-free?
Gain an accurate and empirical measure of regional and local trends, market share, trade areas, and demographics within asset or market at large, whether it's yours or your peers'.
Benefits
Spot Trends First
Find and quantify trends that you can capitalize on before anyone else.
Superior Diligence
Select the best assets with data-driven decisions.

Global Transparency
Gain intelligence on activity and trends on a global scale.
Automation
Be alerted of activity where you’re interested.
Got Questions?
Let's have a conversation about how Orbital Insight GO can help answer them.

Schedule a Demo
Fields containing * are required.