


- Orbital Insight Blog
- Using Location Intelligence for Optimal Real Estate Decision-making
Blog
Using Location Intelligence for Optimal Real Estate Decision-making
Not too long ago you would find mall owners looking up license plate registrations or asking their customers to mark their home locations with push pins to understand the habits of shoppers. A lack of data meant a poor understanding of their own clientele and almost no competitive intelligence on similar properties.
As a geospatial solution democratized for all, GO is the go-to tool for deciphering retail sector riddles such as: How many people are there in a mall at a time? How frequently do they visit? How long do they spend there? Where do they travel from? How long does it take them to get there? Are they going to other places as well? And, also, who are these customers? How old are they? What work do they do? How much do they earn?
All these are invaluable to mall owners or future developers — and just about anyone invested in the sector or have the need to track it, from property developers to local municipalities positioning their communities for investment and growth. Digitally-mined customer origin and behavioral data practically tell retailers these days which areas they need to expand in, where they might benefit in diversifying or when a store might do better to just close.
Amid the proliferation of artificial intelligence in investment and business decision-making, GO has increased its multi-modal intelligence to include satellite-detected objects such as cars, trucks, and planes, millions of devices and connected cars.
We normalize millions of daily geospatial observations to deliver objective, transparent and timely analytics to cover your specific area of interest and timeframe.
Once the domain of quantitative hedge funds with in-house machine learning expertise, GO has made geospatial datasets available to all seeking informational-edge financial securities analysis. Our clients have applied AI and geospatial data to illuminate supply chains, prevent deforestation, and further national security. Here, we will focus on how real estate investors are using geospatial analytics to get the clearest and most recent view into real estate and infrastructure across four areas of interest in Connecticut.
Market Share
For instance, using GO to track Simon Property Group’s (NYSE:SPG) Clinton Crossing Premium Outlets and Levin Management’s Westbrook Outlets, an investor or analyst will be able to discern if the two crosstown rivals, which are six miles apart in Connecticut’s Hartford Metropolitan area, are cannibalizing each other’s market share.
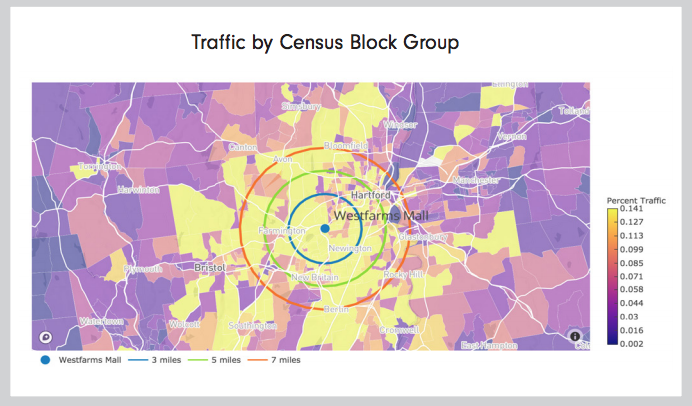
Using similar traffic and customer mobility data, our case study on Westfarms Mall in central Connecticut indicates it has increased its market share from 45% to nearly 61% within half a year.
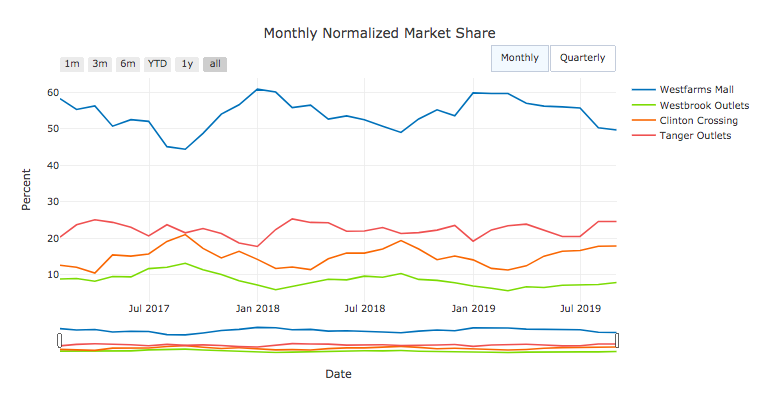
GO enables us to arrive at such conclusions through the study of advanced trade area analytics that include spatial visualizations, average distance traveled, traffic attribution by home and work locations and visualized traffic routes.
We have the ability to understand if customers are going to competitors’ centers, and if so, what percentage of traffic it cannibalizes and how that changes over time as consumer tastes evolve.
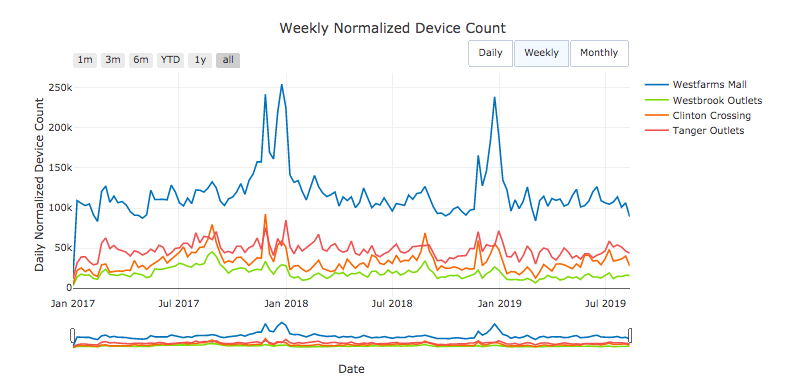
Customer Visitation & Foot Traffic
Customer visitation is the underlying indicator of retail real estate asset performance and health.
By measuring daily empirical foot traffic in a portfolio or a particular acquisition target, and using it with competitive peer sets, one gains a decisive edge in investment decisions. It also helps professionals better conduct site selection by comparing the effects of seasonal trends, promotions, holidays, and new tenant mixes with years of historical data.
GO customers have highly accurate foot traffic counts to evaluate site selection by comparing visitation at individual properties and the broader market. The Orbital Insight technology provides advanced consumer insights into daily property visitation and seasonal trends, customer loyalty/revisit, cross-shopping analytics and time of day/day of week traffic analysis.
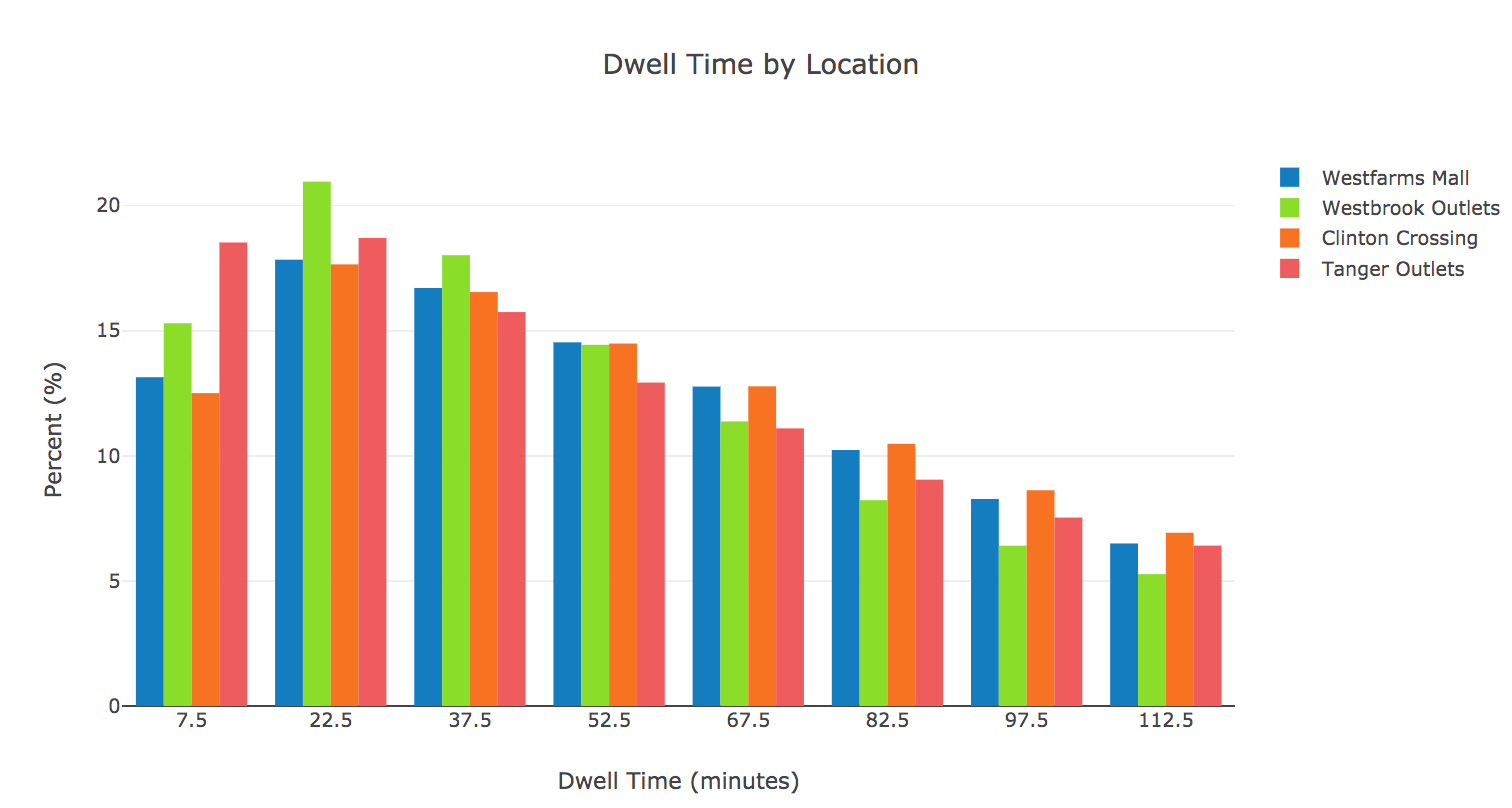
For example, our study of Westfarms Mall shows that one-third of mall traffic dwelled at the center for up to 22.5 minutes. Developers seeking to elevate the customer experience at their centers with entertainment concepts can use dwell time as an objective measurement of engagement.
Trade Areas
Since the device pings we collect across the United States have anonymized origins, we are able to understand their origin and this helps us calculate what is known in consumer markets as trade areas.
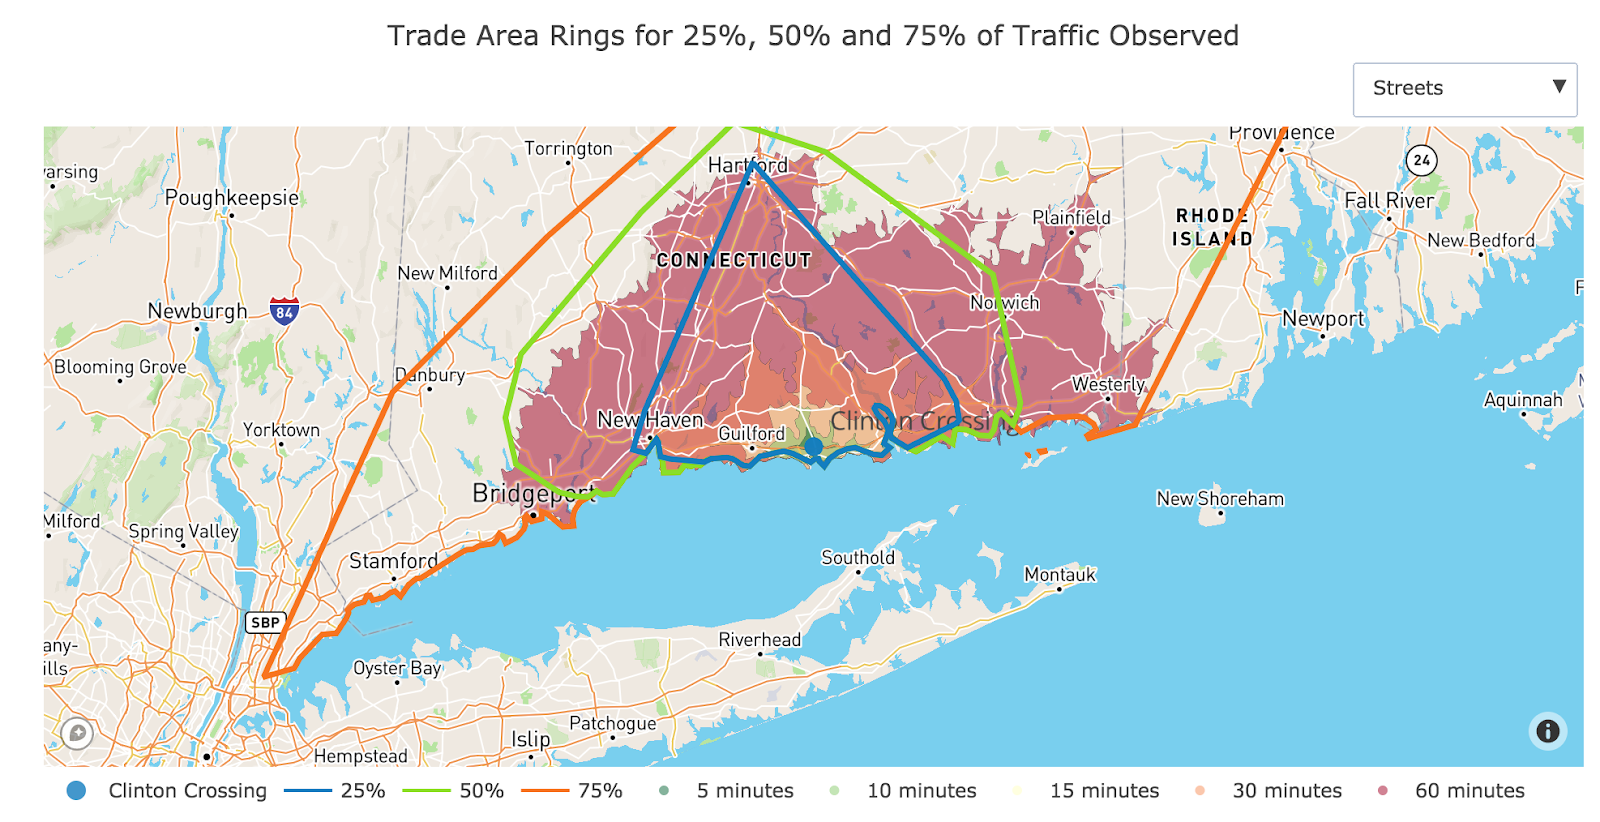
For instance, if we were to look at any of Tanger Outlets’ locations, we’d know the origins of their customers in relation to the location of their specific outlets. We’d then calculate the median distance traveled to that location by customers and aggregate the data on a monthly basis. This helps us see how far people travel in a particular month to get to any of the outlets. On major sales occasions such as Black Friday, there would logically be more people traveling farther distances to get to a Tanger outlet.
Trade area modeling allows mall owners to better select sites and forecast retail revenues. Brokers are able to better market properties by determining the ‘draw’ of a center. With GO’s trade area modeling, we are able to understand at a more granular level where a mall’s visitors are coming from and what proportion of foot traffic they represent.
Demographics
Businesses use government data to develop site selection and marketing strategies regarding target customer home locations, income, and whether or not they have children. However, fixed radial trade areas based on government demographics are often outdated and do not represent actual patterns or customer bases. This means that while government data is helpful, it is not always timely. The U.S. Population and Housing Census, for example, is taken every 10 years. Government data is also not necessarily representative of a specific retailer’s clientele.
Geospatial analytics provides a hyperlocal census into your target asset. Unlike Point of Sales data and customer loyalty programs, GO can provide empirical demographics into properties outside of a portfolio, including acquisition candidates and compensations.
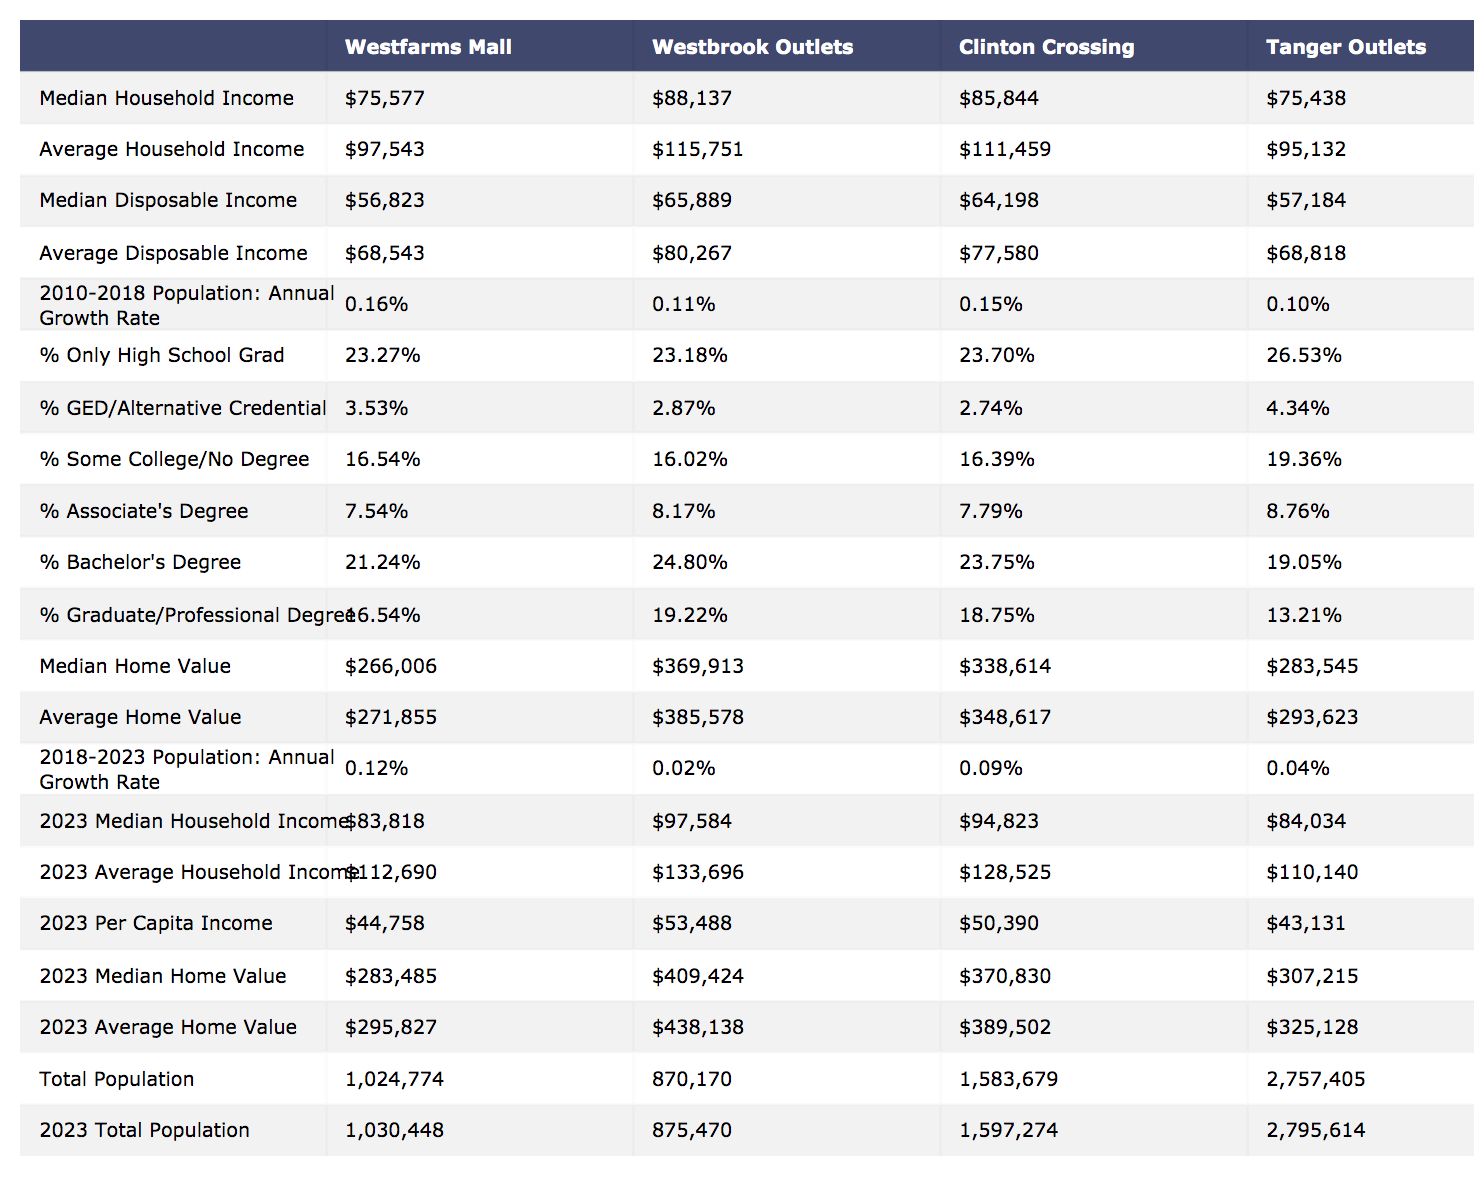
Using location-specific demographic trends, Orbital Insight can reveal any property’s demographics including median household income; per capita income; median distance from home location; average household income; percentage of Bachelor’s and Graduate degree holders; and 2023 average household size estimates.
In the old days, retailers needed to carry out laborious and sometimes costly surveys to mine demographic data. One route was collecting credit card and other customer information at Point-of-Sale centers, usually through additional marketing and promotional activity. Another popular strategy was to have loyalty clubs/rewards programs to retain legacy customers’ information and ensure repeat sales within the retailer’s ecosystem. But the processes involved also mean that such data cannot be obtained at whim.
With GO, studying customer origin and mobility data can be done in real-time or whenever necessary. For instance, the Simon Group, which owns the Clinton Crossing properties, just needs GO’s trade area modeling to determine which zones account for more customer loyalty and which pockets need additional work. an analyst can integrate this data and overlay it with existing information in a Geographical Information System (GIS) such as ESRI’s ArcGIS.
By leveraging geospatial data, GO is able to create highly accurate and even predictive trade area models using IoT device data, demographic data, and drive times. Using geospatial analytics, commercial real estate investments and policy decision-makers are powered by empirical data of a representative customer base and the travel routes they take.
Recommended for You
-


Jan 21, 2020
Building Footprint Comparison in Cambodia: Orbital Insight and OpenStreetMap
Learn More -


-

