


- Orbital Insight Blog
- Analyzing the Beirut Explosion with Geospatial Analytics
Blog
Analyzing the Beirut Explosion with Geospatial Analytics
Tragedy in Beirut
At least 135 people were killed and 5,000 wounded as of August, 5 2020 (5:20 pm EST), in the Beirut explosion. With hundreds reported missing and a lack of clarity regarding the cause of the explosion, geospatial analytics helps government analysts, NGOs, and first responders gain critical visibility into the catastrophe and have the potential to save lives.
Gaining Immediate Visibility with Satellite Imagery
Our health, safety and security depend on governments and NGOs maintaining an accurate picture of the world. However, current sources of information about what’s happening on and to the Earth are often incomplete, outdated and analyzed manually. Orbital Insight helps organizations like the U.S. Air Force, Department of Defense, Defense Innovation Unit and The World Bank zoom in on the physical world to detect anomalies, prevent surprises and respond with the right security policies, communications and aid.
Orbital Insight uses AI to transform multiple sources of geospatial data—satellite images, mobile location, connected cars and other IoT data—into objective answers to critical security questions. These capabilities empower our clients to lead at the forefront of technology and reveal hidden changes faster for humanitarian and economic purposes.
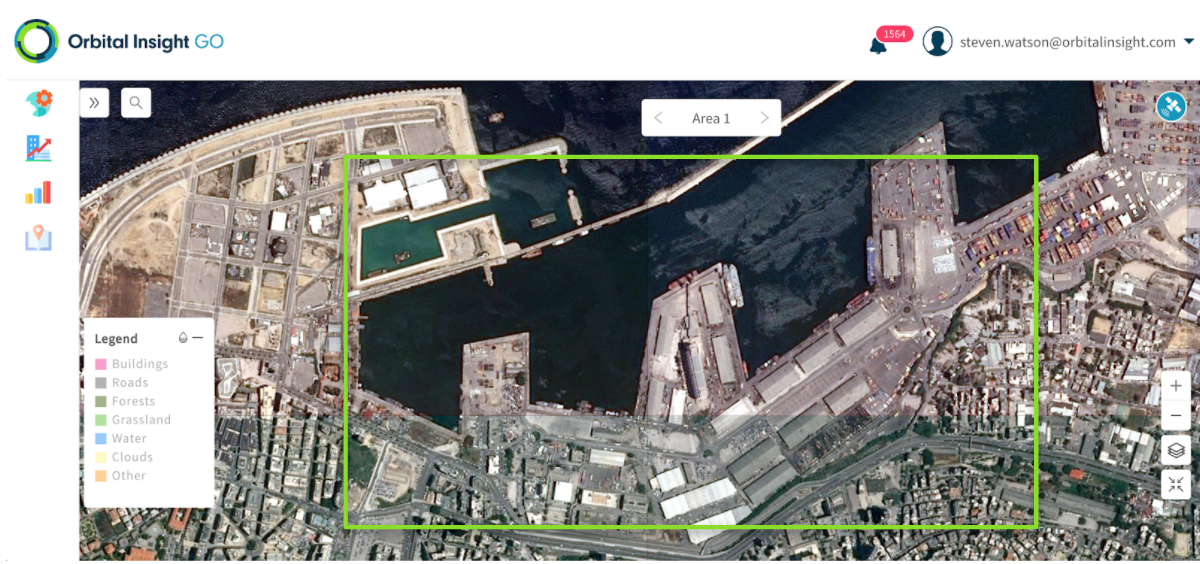
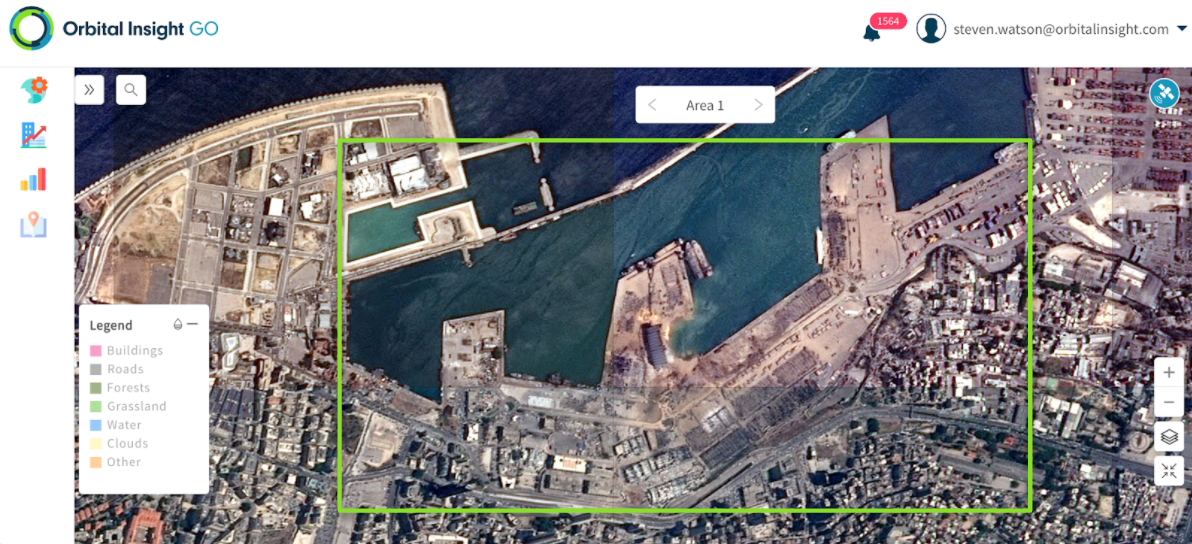
We applied our commercial technology to rapidly identify granular infrastructure change resulting from the explosion to support humanitarian efforts. By analyzing today’s Airbus 1.5m resolution SPOT imagery with Orbital Insight’s land use algorithms, we analyzed over 180,000m2 within a matter of minutes.
From Imagery to Analytics
Satellite imagery is a powerful tool in providing real-time answers and qualitative information into global change, however, imagery analysis is a timely and manual process. Our computer vision algorithms are purpose-built for automatically and accurately identifying various changes in land-use at scale, such as buildings, roads, forests, and water.
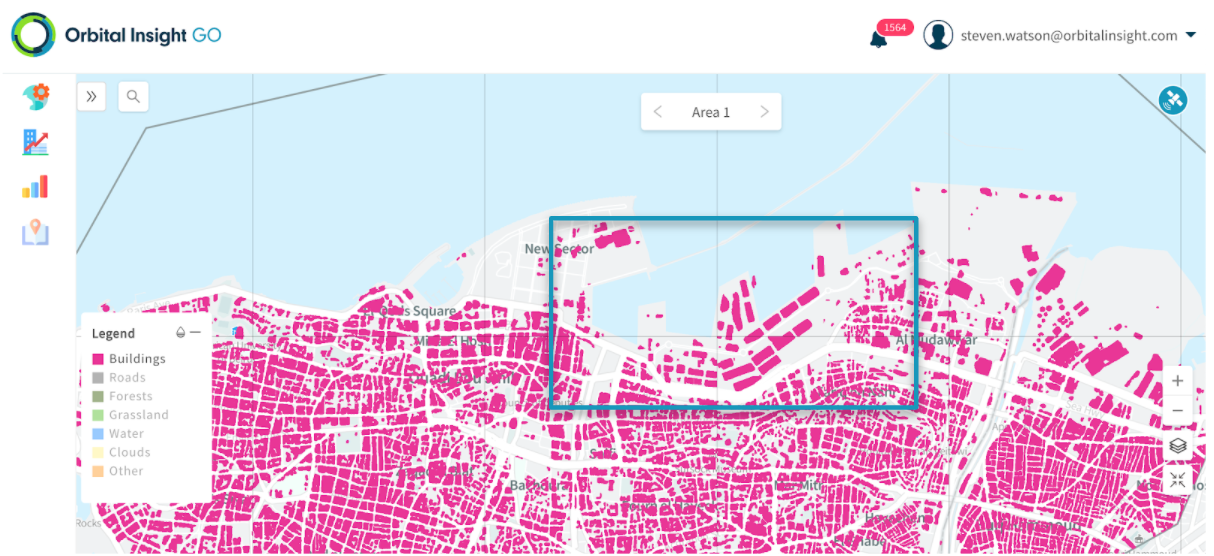
Orbital Insight GO can accomplish this in a matter of minutes, bringing together a historical archive of the latest and historical satellite imagery, automated land use mapping, and period comparisons for change detection.
This process would take hours and possibly even days without the support of computer vision algorithms. An analyst would need to manually compare post-disaster imagery to baseline data, sourcing available imagery, finding building footprints in a platform like OSM, create annotations, and compare the findings to quantify the output. Our blog post from January 2020 explains why open source platforms often need objective satellite imagery analysis to understand the latest changes in infrastructure.
Quantifying the Damage
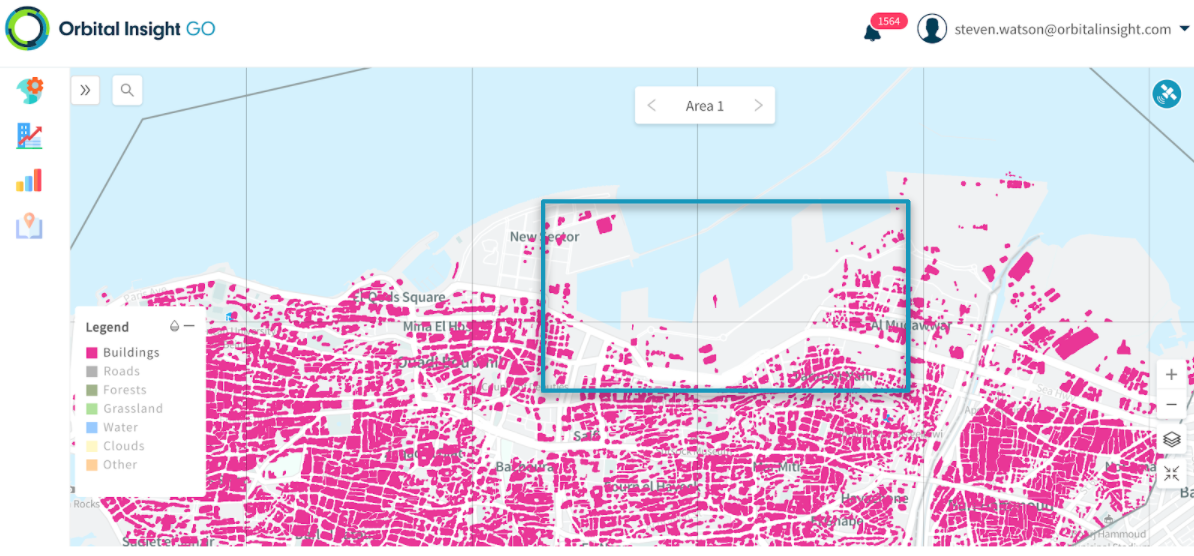
Overlaying computer vision results from May and August show exactly which structures were destroyed in the explosion in one single image. Blue indicates remaining structures, while red indicates the specific buildings destroyed in a single view.
In this instance, where the location of the disaster was widely reported, our technology was useful in rapidly confirming and quantifying the damage it caused. However, this same approach could also be used in less-documented cases, without as much corroborating information, in order to find similar on the ground changes over a wide-area in a search/discovery capacity.

Potential Loss of Vessel and Cargo Loss
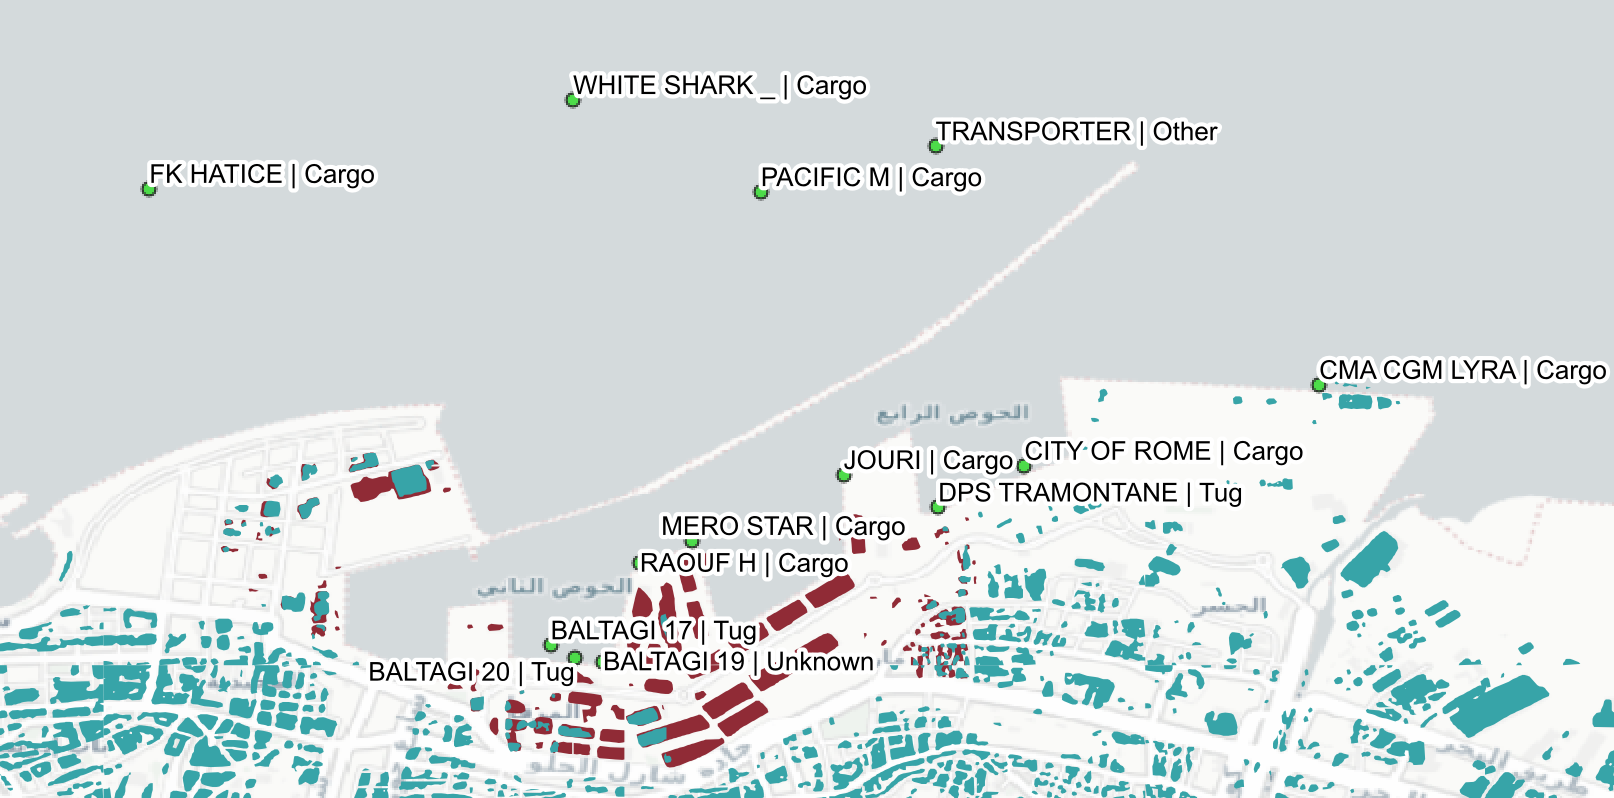
Orbital Insight's AIS analytics also allows us to layer additional data sources that give insight into maritime activity and shipping. This vessel transponder data is primarily used for safety and navigation, but also provides high-frequency signals into port activity, including cargo shipments and commodity movements. At the time of the explosion, Orbital Insight identified several cargo vessels in the port, proximate to the blast radius. Insurance companies will require such data when conducting their claims investigations.
The labels below indicate the ship's position, name, and reported vessel type.
Driving Positive Outcomes with Data
Our multi-source approach is rooted in the belief that the richest analytics are created when differentiated data sources are combined. Our internal analysts will apply data sources such as anonymized cell phone geolocation to identify possible locations where first responders should focus relief efforts. We will also apply AIS data to understand shipping patterns at the port in the wake of the tragedy to understand potential supply chain disruptions that may impact Lebanon.
If you are a humanitarian organization or existing Orbital Insight customer that would like to access this data, please contact us at insight@orbitalinsight.com.
Recommended for You
-


blog
Jan 21, 2020
Building Footprint Comparison in Cambodia: Orbital Insight and OpenStreetMap
Learn More