


- Orbital Insight Blog
- How to get ROI from Geospatial Intelligence (Part 2)
Blog
How to get ROI from Geospatial Intelligence (Part 2)

5 steps that’ll take you from start to fully operational, to help you drive sales, reduce risk and cut costs
In part one of this topic, How to get ROI from Geospatial Intelligence, we focused on the importance of telling a complete story around any place in the world. The proposed concept focuses on the premise that effective use of geospatial data calls for a process built upon multiple sources of various types of data. This multifaceted approach to telling stories enables a more robust and scalable process because telling a complete story helps give more profound insights and enables storytelling in places on the Earth where certain types of data are less prevalent.
Once you buy into the concept, there are certain things to consider in your approach to bringing it to life. Below are five steps to take, as you go from standing up your geospatial intelligence solution to an operational process that helps you drive sales, reduce operational risk and cut costs. However, without a systematic approach to your program, you risk buying the wrong tools, and building a process that won’t scale.
The 5 Steps:
Step 3: Decide what’s important to know
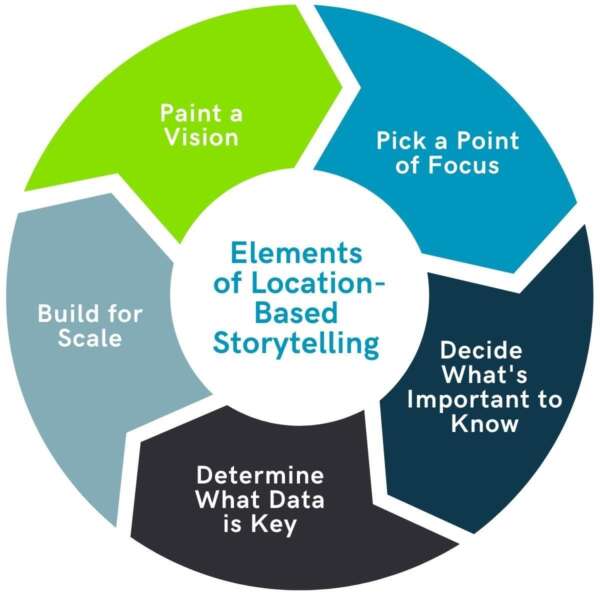
Step 1: Paint a vision
What do you want your location-based storytelling vision to be? For example, one such idea could be that I will build a command center that helps me monitor many places simultaneously so I can know when material changes occur that warrant my attention. In a world of limited resources, knowing where I should focus my attention is critical to helping me make decisions more quickly. In addition, this vision is a tangible way to start building a new process that will help you get started.
Step 2: Pick a point of focus
Where in your business would it be helpful to be able to map many locations to help you learn things you don’t know or can’t see currently? There are many places you can use geospatial analytics in your business. The possibilities are endless, from mapping and monitoring your supply chains to comparing and contrasting 1000 sites where you do business or even checking to see how land use has changed.
Step 3: Decide what’s important to know
What key business questions can be answered by monitoring one or many places at once? For example, if you’re monitoring your supply chain, you may want to know if your competitor's site is operating normally or not. If you’re Taco Bell, you might want to understand if your new item launch is weak in certain parts of the country, and which competitor seems to have more customers coming to them in a particular region. If there’s a crisis, such as the one currently going on in Ukraine, you may want to see if manufacturing is still normal or if it’s down - and by how much. Again, by picking the important elements you want to know, you can begin to design questions that if answered, will help drive your business.
Step 4: Determine what data is key
What data do I need to tell the best stories? Each part of your business that you want to apply geospatial analytics can require different data. For shipping, you might want AIS geospatial data. To understand the opportunity to buy a new building, you might need foot traffic data to see how many people go there, how far they travel, and where else they frequent when they leave during the day. If you are in the mining industry, you might want to use satellite data to monitor the construction of a new part of a plant. The point is that varying data has different values depending on what you want to study and learn. Think about what data you need to succeed.
Step 5: Build for scale
If I’m monitoring a wide array of locations, what data can be used to ensure I can get the whole story? The funny thing about data is that it can fray. And by fray, we mean that at any given location, the amount of information available at some point will be too small to tell your story. So if you don’t have a lot of ways to bring that story to life, you can fail to build your scalable process. For example, suppose you’re monitoring a series of manufacturing plants across the globe and only rely on geospatial data (foot traffic) to alert you to changes occurring. In that case, all sites aren’t the same. Your biggest plant in Chicago might tell a great story because it has 1000s of employees, but a plant you also need to monitor in rural Brazil may only have 50 employees, so the signal you need doesn’t exist. If you also have connected cars/trucks and even thermal imaging, the opportunity to measure changes increases. Having more data at any given place will be the difference between a scalable process and a limited process.
The amount of information with which you can understand what is happening on and to the Earth is increasing exponentially. To be strategic about the program you build, you need to be sure to widen your lens. The truth is, geospatial analytics is about places on Earth. It isn’t about any single data source. By thinking about how you can understand what’s happening at any given place, around that given place, and comparing that place to many others, the pictures you can begin to paint become like art. Creating robust stories that help you understand many key elements your business craves will help ensure that you win in the marketplace, time and time again. If you focus on bringing insights to life, rather than simply collecting data, the odds are that you’ll gain the edge you need to climb.
Recommended for You
-

blog
Feb 17, 2022
How to Choose The Right AI-Driven Geospatial Analytics Platform (Part 1)
How to choose the right AI-driven Geospatial Analytics platform? Get an overview of the analytical workflow, common problems associated with geospatial data - and how to overcome them - in part 1 of our two-part series.
Learn More
blog
Mar 17, 2022
How to get ROI from Geospatial Intelligence (Part 1)
How to get ROI from Geospatial Intelligence | In part 1, learn the 3 critical things to know about your first geospatial analytics program
Learn More